Share report on Facebook!
Share on facebook
Share report on Twitter!
Share on twitter
Share report on LinkedIn!
Share on linkedin
Email a link to this Report!
Share on email
Download tile as an image.

Baltimore | October 2020

Home Demand Index

The Bright MLS | T3 Home Demand Index for the Baltimore MLS market area was at 137 in September, a reading in the High range and unchanged over the month. Compared with one year earlier, the Index was 33 percent higher, reflecting strong demand for homes across the market area.
The strength of demand among the types of homes ranged from 81 for lower-priced single-family homes to 201 for higher-priced single-family homes. All segments except lower-price single-family homes were in the High demand category in September. Although reflecting different levels of buyer interest, the Index for nearly all segments was substantially higher compared with the level one year earlier.

Inventory levels were very lean in September, ranging from just a one-month supply in the mid-priced single-family segment to a 3.5 months supply in the higher-priced condo segment. Overall, the data suggest a strong level of demand for homes in the Baltimore market area and a high level of interest among buyers seeking to complete a home purchase transaction.
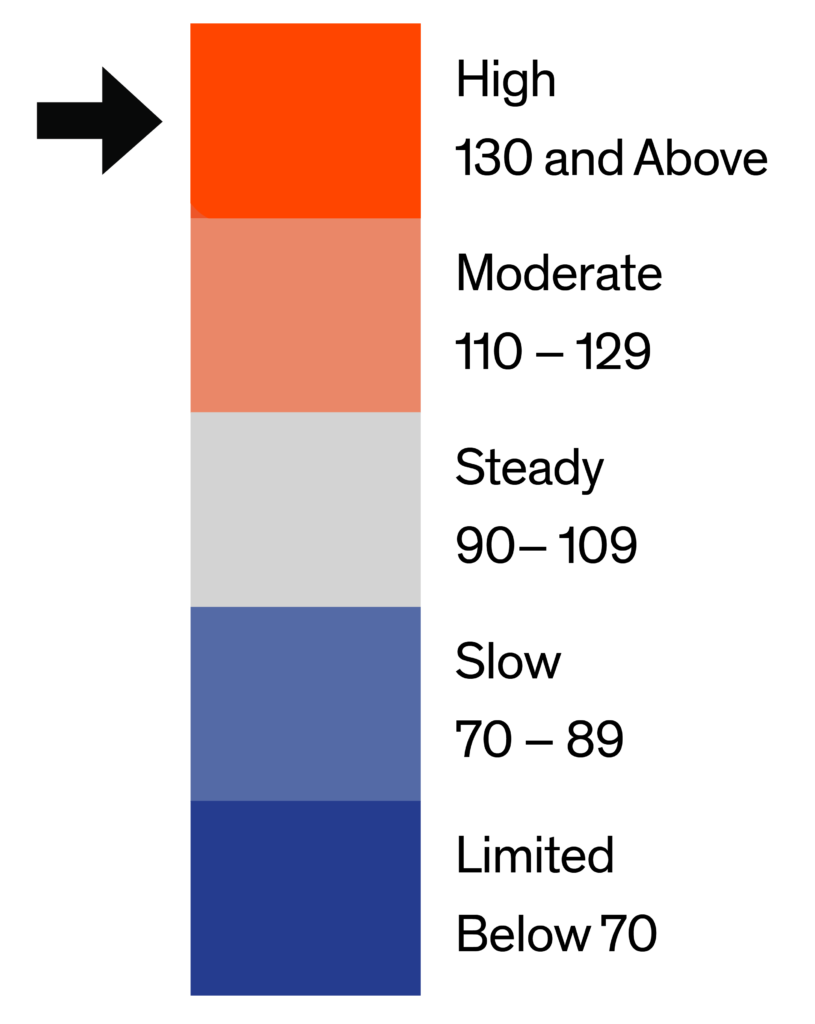
Monthly Statistics for October 2020
Home Demand
Index
137
(High)
Home Demand Index
from prior month
137
Home Demand Index
from prior year
103
Index change
from prior month
0%
Index change from
same time last year
33%
Bright MLS | T3 Home Demand Index

www.homedemandindex.com

Download tile as an image.
Embed this tile on your site.

Baltimore | October 2020

Home Demand Index | Historical Year-over-Year Comparison

Home demand peaked in June following a sharp decline in the normally busy months of March and April. The Covid-19 pandemic and ensuing economic recession temporarily sidelined some buyers, even as low mortgage interest rates spurred other would-be buyers to search for a home. The Index has been well above the level from one year earlier since June reflecting a high level of interest among buyers despite challenges in the home search process.

Home Demand Index

Bright MLS | T3 Home Demand Index

www.homedemandindex.com

Download the top-level Market Areas map as a screenshot.

Embed this tile on your site.

Baltimore | October 2020

Home Demand Map

Buyer interest was generally strong across the entire Baltimore market area. Fifty-one percent of ZIP codes recorded an Index reading in the High category with an additional 13 percent in the Moderate category. Buyer interest in the remaining ZIP codes was softer with fewer than 10 percent in either the Slow or Limited category.
Bright MLS | T3 Home Demand Index

www.homedemandindex.com

Download tile as an image.
Embed this tile on your site.

Baltimore | October 2020

Demand and Inventory by Home Type

The strength of demand among the types of homes ranged from 81 for lower-priced single-family homes to 201 for higher-priced single-family homes. All segments except lower-price single-family homes were in the High demand category in September. Although reflecting different levels of buyer interest, the Index for nearly all segments was substantially higher compared with the level one year earlier.

Inventory levels were very lean in September, ranging from just a one-month supply in the mid-priced single-family segment to a 3.5 months supply in the higher-priced condo segment. Overall, the data suggest a strong level of demand for homes in the Baltimore market area and a high level of interest among buyers seeking to complete a home purchase transaction.

Bright MLS | T3 Home Demand Index

www.homedemandindex.com

Download tile as an image.

Baltimore | October 2020

Single Family Home Below $250k

Buyer interest in the lower-priced single-family segment was down marginally between August and September and 23 percent below the year-earlier level. The recession, with significant fallout for lower-income households, weighed on demand as reflected in a Slow reading for the Bright MLS | T3 Home Demand Index. With just 1.1 months supply, would-be buyers were challenged in their search for a home.
Monthly Statistics for Single Family Home Below $250k
Home Demand
Index
81
(Slow)
Home Demand Index
from prior month
86
Home Demand Index
from prior year
105
Months of
inventory
1.1
Average daily inventory last month
399
Inventory sold
last month
353
Bright MLS | T3 Home Demand Index

www.homedemandindex.com

Download tile as an image.

Baltimore | October 2020

Single Family Home $250k - $590k

In contrast to lower-priced single-family homes, demand indicators suggest a High level of buyer interest in the mid-priced single-family segment. The Bright MLS | T3 Home Demand Index, at 145, rose eight percent during the month and was 42 percent higher compared with one year earlier. Inventory was very lean in September at just a one-month supply, leaving would-be buyers in this price range with limited choice when searching for a home.
Monthly Statistics for Single Family Home $250k - $590k
Home Demand
Index
145
(High)
Home Demand Index
from prior month
134
Home Demand Index
from prior year
102
Months of
Inventory
1
Average daily inventory last month
1,281
Inventory sold
last month
1,270
Bright MLS | T3 Home Demand Index

www.homedemandindex.com

Download tile as an image.

Baltimore | October 2020

Single Family Home Above $590k

Buyer interest in single-family homes priced above $590,000 fell in September compared with August but remained at a High level. With a reading of 201 in September, the Index was 90 percent higher compared with one year earlier reflecting pent-up demand from the delayed spring buying season supported by low mortgage interest rates. The number of homes available for sale was equivalent to just two months at the current sales pace.
Monthly Statistics for Single Family Home Above $590k
Home Demand
Index
201
(High)
Home Demand Index
from prior month
214
Home Demand Index
from prior year
106
Months of
Inventory
2
Average daily inventory last month
878
Inventory sold
last month
448
Bright MLS | T3 Home Demand Index

www.homedemandindex.com

Download tile as an image.

Baltimore | October 2020

Condo Below $310k

The lower-priced condo segment experienced a High level of buyer interest in September. The Bright MLS | T3 Home Demand Index was at 144, reflecting an increase of 11 percent during the month and a 41 percent rise compared with one year earlier. Strong demand among first-time buyers and buyers priced-out of other segments of the market likely drove much of the increase. The months supply was just 1.7 in September.
Monthly Statistics for Condo Below $310k
Home Demand
Index
144
(High)
Home Demand Index
from prior month
130
Home Demand Index
from prior year
102
Months of
Inventory
1.7
Average daily inventory last month
378
Inventory sold
last month
226
Bright MLS | T3 Home Demand Index

www.homedemandindex.com

This is Tooltip!

Baltimore | October 2020

Condo Above $310k

Buyer interest was intense in the higher-priced condo segment, with the Bright MLS | T3 Home Demand Index posting a reading of 193 in September. The Index was down slightly over the month but was 86 percent higher compared with one year earlier This is the smallest segment of the market based on listings and sales, so indicators are likely to be more volatile than other types of homes with a greater volume of activity. Inventory conditions for buyers were the most favorable compared with other segments with a 3.5 months supply.
Monthly Statistics for Condo Above $310k
Home Demand
Index
193
(High)
Home Demand Index
from prior month
202
Home Demand Index
from prior year
104
Months of
Inventory
3.5
Average daily inventory last month
190
Inventory sold
last month
54
Bright MLS | T3 Home Demand Index

www.homedemandindex.com

This is Tooltip!

Baltimore | October 2020

Townhouse/Rowhouse/Twin All prices

Townhouse/
Rowhouse/Twin
All prices

The Bright MLS | T3 Home Demand Index for the townhouse segment fell seven percent between August and September but remained in the High category. The Index was 36 percent higher than one year earlier, reflecting exceptionally strong buyer interest. Much like the single-family segments, the months supply was low at just 1.4 months.
Monthly Statistics for Townhouse/Rowhouse/TwinAll prices
Home Demand
Index
139
(High)
Home Demand Index
from prior month
149
Home Demand Index
from prior year
102
Months of
Inventory
1.4
Average daily inventory last month
2,347
Inventory sold
last month
1,703
Bright MLS | T3 Home Demand Index

www.homedemandindex.com

Note

1. This report is generated with data from the following counties: Anne Arundel, MD; Baltimore City, MD; Baltimore, MD; Carroll, MD; Harford, MD; Howard, MD
2. This report is for the October 2020 period with data collected from the previous month.
Released: March 1, 2021
Reference ID: 1070

Baltimore | October 2020

Home Demand Map (Zip Codes)

Buyer interest was generally strong across the entire Baltimore market area. Fifty-one percent of ZIP codes recorded an Index reading in the High category with an additional 13 percent in the Moderate category. Buyer interest in the remaining ZIP codes was softer with fewer than 10 percent in either the Slow or Limited category.
Bright MLS | T3 Home Demand Index

www.homedemandindex.com

Embed the Timeline

To embed the map on your website, copy and paste the code below. Please note that the ideal dimensions for displaying the map are 1312 pixels wide by 660 pixels high.

Embed the Map

To embed the map on your website, copy and paste the code below. Please note that the ideal dimensions for displaying the map are 1312 pixels wide by 1182 pixels high.

Embed the Housing Type Bar Chart

To embed the map on your website, copy and paste the code below. Please note that the ideal dimensions for displaying the map are 1312 pixels wide by 880 pixels high.