September 2021 Report
Washington D.C. Metro
Washington D.C. | September 2021
Home Demand Index
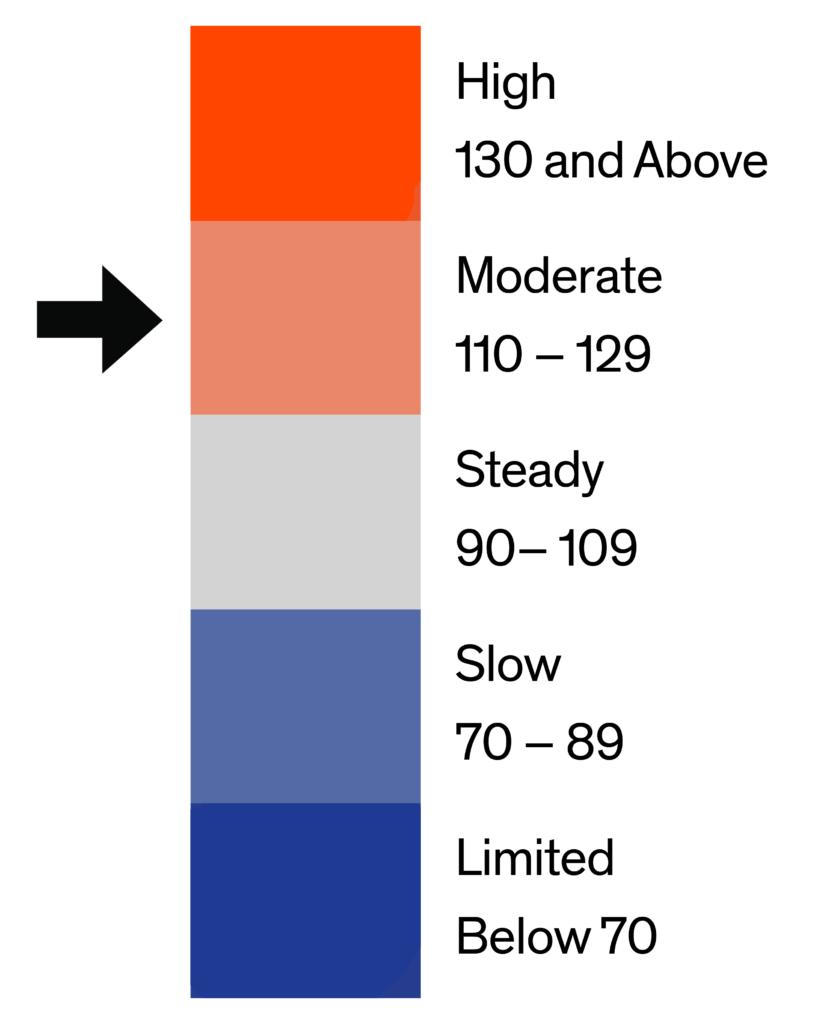
The August Bright MLS | T3 Home Demand Index for the Washington Metro market area was virtually unchanged over the month at 122, reading in the Moderate range of demand. The Index was 12 percent lower than one year earlier.
In August, demand was High for all types of homes except lower-priced single-family and townhouses. Consistent with the past several months, lower-priced single-family homes exhibited the weakest demand. While demand for higher-priced condos decreased significantly, the Index changed little over the month among other types of homes. Inventory levels remained tight ranging from a 1.2 months supply for mid-priced single-family homes to a 3.1 months supply for higher-priced condos. The monthly supply for each type of home rose marginally over the month.

Monthly Statistics for September 2021
Home Demand
Index
Index
122
(Moderate)
Home Demand Index
from prior month
from prior month
123
Home Demand Index
from prior year
from prior year
139
Index change
from prior month
from prior month
-0.8%
Index change from
same time last year
same time last year
-12.2%
Bright MLS | T3 Home Demand Index
www.homedemandindex.com
Washington D.C. | September 2021
Home Demand Index | Historical Year-over-Year Comparison
Following a spring homebuying market with High demand, buyer interest in Washington Metro area homes eased to a Moderate pace in July where it remained in August. The Index has been below the year-earlier level for the past two months largely because some of the usual spring activity last year was pushed forward into the summer months.
Home Demand Index
Bright MLS | T3 Home Demand Index
www.homedemandindex.com
Washington D.C. | September 2021
Home Demand Map
Demand in five of the nine counties that make up the Washington Metro market area was High in August. The Index was at a Moderate level in Prince Georges and Montgomery counties and Steady in Frederick County and Washington, DC. Buyer interest was High in the Southern Maryland and Maryland-West Virginia Panhandle market areas and Moderate in the North Central Virginia region. Demand in half of ZIP codes in the Greater Washington area was in the High or Moderate category.
Bright MLS | T3 Home Demand Index
www.homedemandindex.com
Washington D.C. | September 2021
Demand and Inventory by Home Type
In August, demand was High for all types of homes except lower-priced single-family and townhouses. Consistent with the past several months, lower-priced single-family homes exhibited the weakest demand. While demand for higher-priced condos decreased significantly, the Index changed little over the month among other types of homes. Inventory levels remained tight ranging from a 1.2 months supply for mid-priced single-family homes to a 3.1 months supply for higher-priced condos. The monthly supply for each type of home rose marginally over the month.
Bright MLS | T3 Home Demand Index
www.homedemandindex.com
Washington D.C. | September 2021
Single Family Home Below $395k
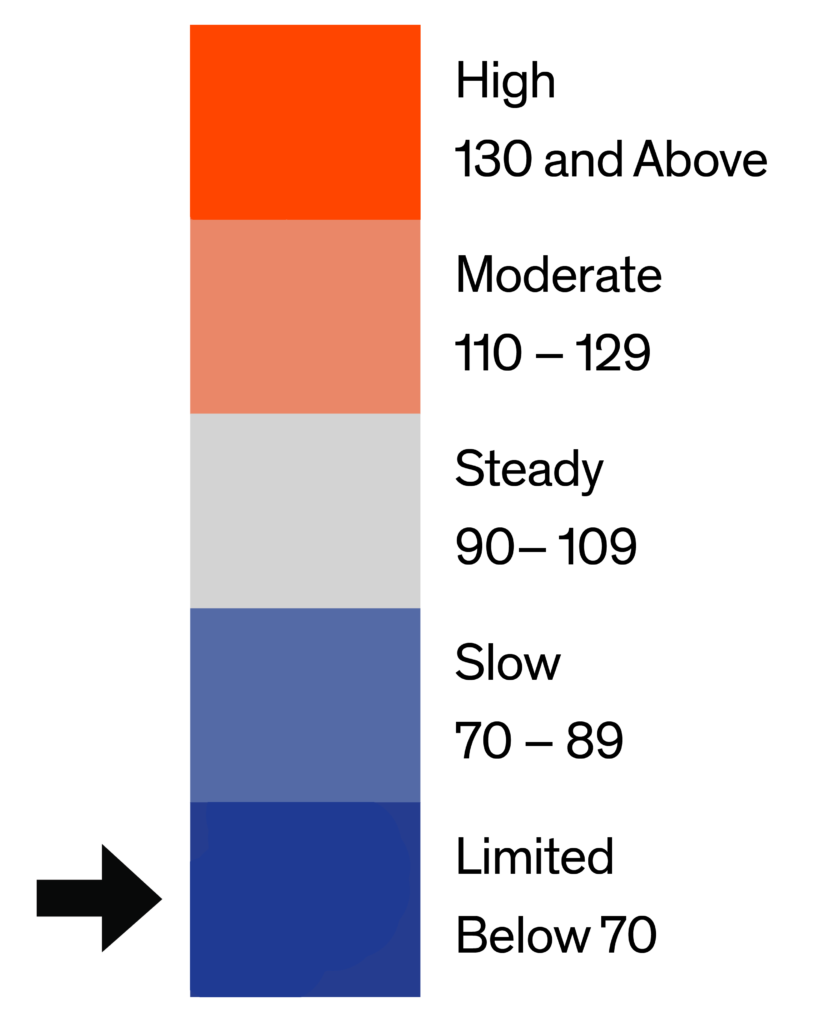
Demand for lower-priced single-family homes rose modestly but remained in the Limited range with an Index reading of 62. Compared to one year earlier, buyer interest has fallen significantly, a greater decline than any other type of Washington Metro area home. Many would-be buyers at this price point have experienced pandemic-related income disruptions while at the same time rising home prices have limited affordability. The monthly supply of homes for sale was low at 1.6 but higher than the July reading of 1.3 months.

Monthly Statistics for Single Family Home Below $395k
Home Demand
Index
Index
62
(Limited)
Home Demand Index
from prior month
from prior month
57
Home Demand Index
from prior year
from prior year
102
Months of
inventory
inventory
1.6
Average daily inventory last month
537
Inventory sold
last month
last month
341
Bright MLS | T3 Home Demand Index
www.homedemandindex.com
Washington D.C. | September 2021
Single Family Home $395k - $950k
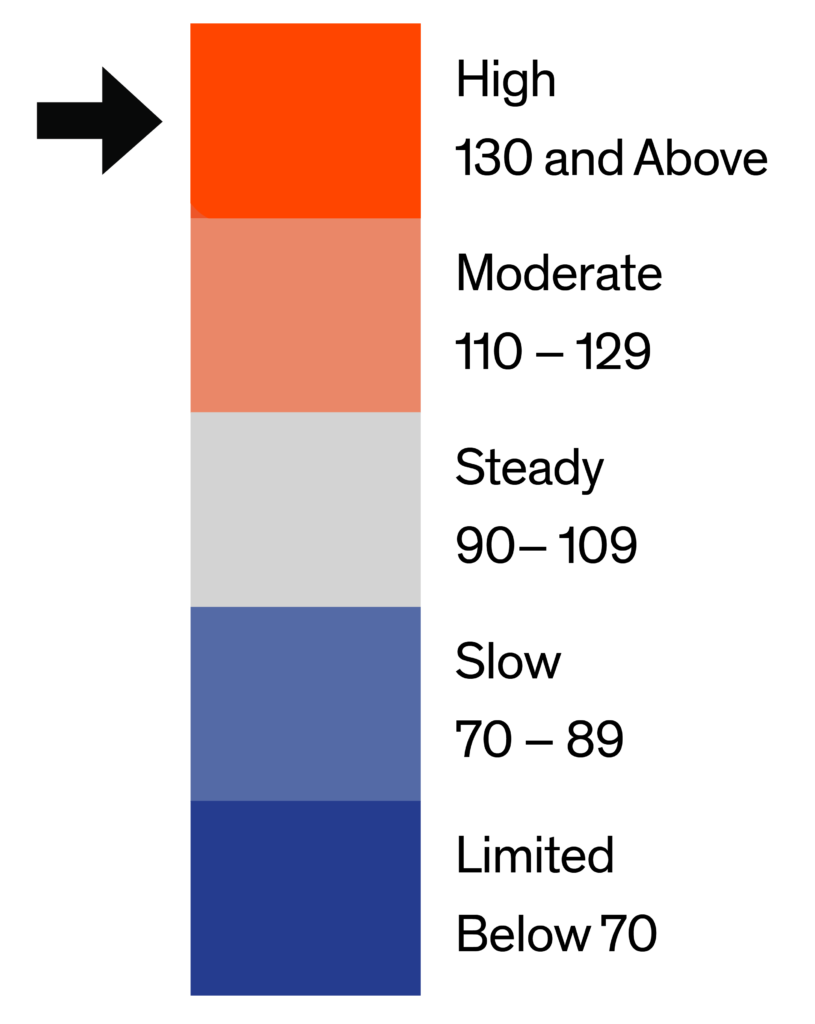
The Bright MLS | T3 Home Demand Index for mid-priced single-family homes was little changed in August but remained in the High range. Compared with one year earlier, buyer interest was only slightly lower suggesting this segment of the market continued to show resilience even through the disruptions of the past several months. The monthly supply of homes was low at 1.2, but higher than the even lower one-month supply in July.

Monthly Statistics for Single Family Home $395k - $950k
Home Demand
Index
Index
132
(High)
Home Demand Index
from prior month
from prior month
131
Home Demand Index
from prior year
from prior year
140
Months of
Inventory
Inventory
1.2
Average daily inventory last month
2,353
Inventory sold
last month
last month
2,001
Bright MLS | T3 Home Demand Index
www.homedemandindex.com
Washington D.C. | September 2021
Single Family Home Above $950k
Demand for higher-priced single-family homes was slightly lower in August with an Index reading of 173, representing a High level of buyer interest. This segment of the Washington Metro market area has recorded the greatest buyer interest for several months despite being the priciest. The strength of demand was also reflected in the low inventory level as new listings have been quickly snapped up. In August, the month’s supply was 1.6, only slightly higher than the July level of 1.4 months.

Monthly Statistics for Single Family Home Above $950k
Home Demand
Index
Index
173
(High)
Home Demand Index
from prior month
from prior month
180
Home Demand Index
from prior year
from prior year
181
Months of
Inventory
Inventory
1.6
Average daily inventory last month
997
Inventory sold
last month
last month
631
Bright MLS | T3 Home Demand Index
www.homedemandindex.com
Washington D.C. | September 2021
Condo Below $570k
The Bright MLS | T3 Home Demand Index for lower-priced condos was nearly unchanged in August compared with the previous month. Demand remained in the High category and was only marginally lower than the level one year earlier. With a 2.4 months supply, home shoppers found a more favorable inventory situation compared with similarly priced single-family homes.

Monthly Statistics for Condo Below $570k
Home Demand
Index
Index
140
(High)
Home Demand Index
from prior month
from prior month
142
Home Demand Index
from prior year
from prior year
150
Months of
Inventory
Inventory
2.4
Average daily inventory last month
2,569
Inventory sold
last month
last month
1,052
Bright MLS | T3 Home Demand Index
www.homedemandindex.com
Washington D.C. | September 2021
Condo Above $570k
Demand for higher-priced condos fell the most in August with a decrease of 16 percent in the Index to 135. Despite the decline, demand remained in the High category. With a 3.1 months supply in August, inventory conditions were more favorable than any other segment of the Washington Metro market area, although higher-priced condos accounted for only five percent of inventory available for sale during the month.

Monthly Statistics for Condo Above $570k
Home Demand
Index
Index
135
(High)
Home Demand Index
from prior month
from prior month
161
Home Demand Index
from prior year
from prior year
175
Months of
Inventory
Inventory
3.1
Average daily inventory last month
533
Inventory sold
last month
last month
172
Bright MLS | T3 Home Demand Index
www.homedemandindex.com
Washington D.C. | September 2021
Townhouse/Rowhouse/Twin All prices
Townhouse/
Rowhouse/Twin
All prices
Buyer interest in townhouses was virtually unchanged in August with an Index reading of 127. Even with a Moderate level of demand, townhouses accounted for one-third of all home sales in the Washington Metro area, more than any other type of home tracked by the Index. Although the monthly supply was only 1.3 in August, this marked an increase from 1.1 months in July.

Monthly Statistics for Townhouse/Rowhouse/TwinAll prices
Home Demand
Index
Index
127
(Moderate)
Home Demand Index
from prior month
from prior month
128
Home Demand Index
from prior year
from prior year
141
Months of
Inventory
Inventory
1.3
Average daily inventory last month
2,893
Inventory sold
last month
last month
2,193
Bright MLS | T3 Home Demand Index
www.homedemandindex.com
Note
1. This report is generated with data from the following counties:
- Maryland-West Virginia Panhandle – Allegany, MD; Berkeley, WV; Garrett, MD; Grant, WV; Hampshire, WV; Hardy, WV; Jefferson, WV; Mineral, WV; Morgan, WV; Pendleton, WV; Washington, MD;
- North Central Virginia – Caroline, VA; Clarke, VA; Culpeper, VA; Fauquier, VA; Frederick, VA; Fredericksburg City, VA; King George, VA; Madison, VA; Manassas City, VA; Orange, VA; Page, VA; Prince William, VA; Rappahannock, VA; Shenandoah, VA; Spotsylvania, VA; Stafford, VA; Warren, VA; Winchester City, VA;
- Southern Maryland – Calvert, MD; Charles, MD; Saint Marys, MD;
- Washington D.C. Metro – Alexandria City, VA; Arlington, VA; Fairfax, VA; Falls Church City, VA; Frederick, MD; Loudoun, VA; Montgomery, MD; Prince Georges, MD; Washington, DC;
2. This report is for the September 2021 period with data collected from the previous month.
Released: September 11, 2021
Reference ID: 1400
Washington D.C. | September 2021
Home Demand Map (Zip Codes)
Demand in five of the nine counties that make up the Washington Metro market area was High in August. The Index was at a Moderate level in Prince Georges and Montgomery counties and Steady in Frederick County and Washington, DC. Buyer interest was High in the Southern Maryland and Maryland-West Virginia Panhandle market areas and Moderate in the North Central Virginia region. Demand in half of ZIP codes in the Greater Washington area was in the High or Moderate category.

Bright MLS | T3 Home Demand Index
www.homedemandindex.com