January 2022 Report
Baltimore Metro
Baltimore | January 2022
Home Demand Index
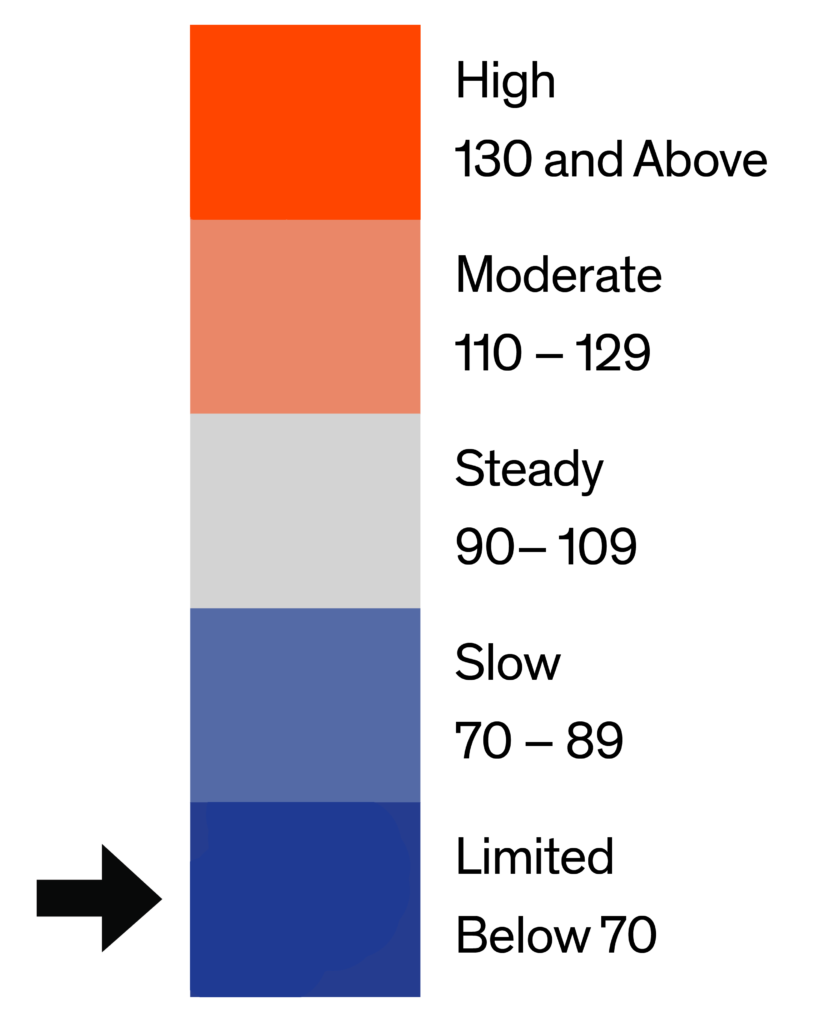
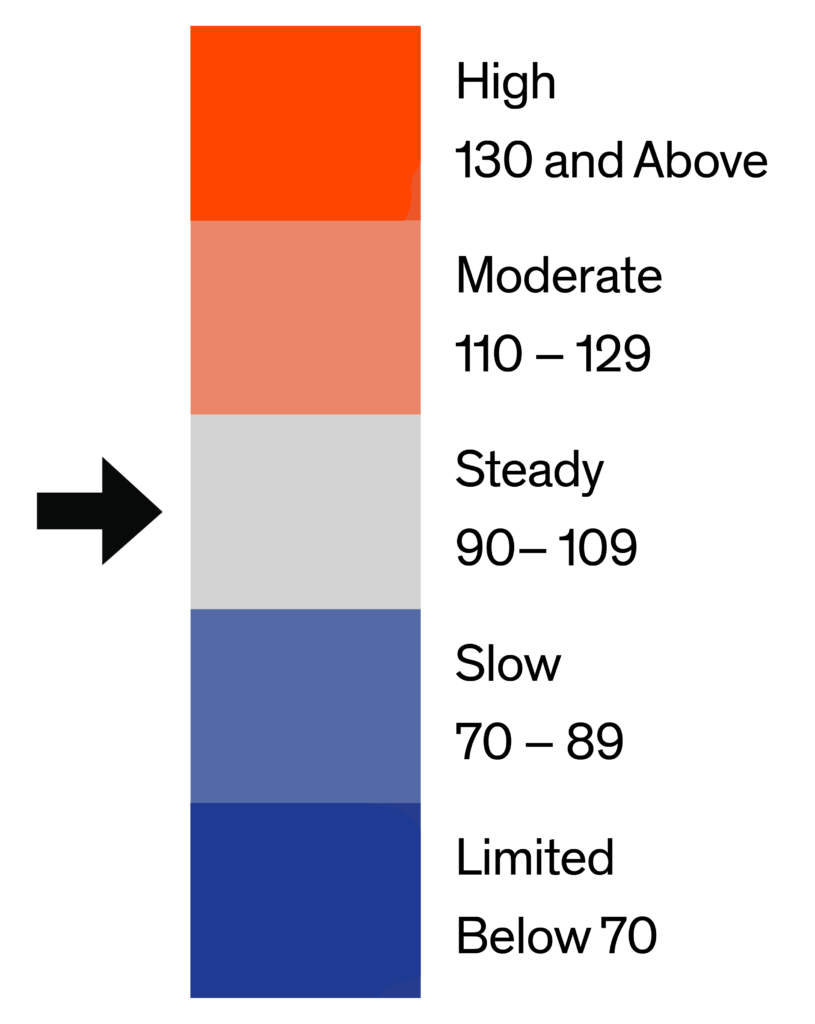
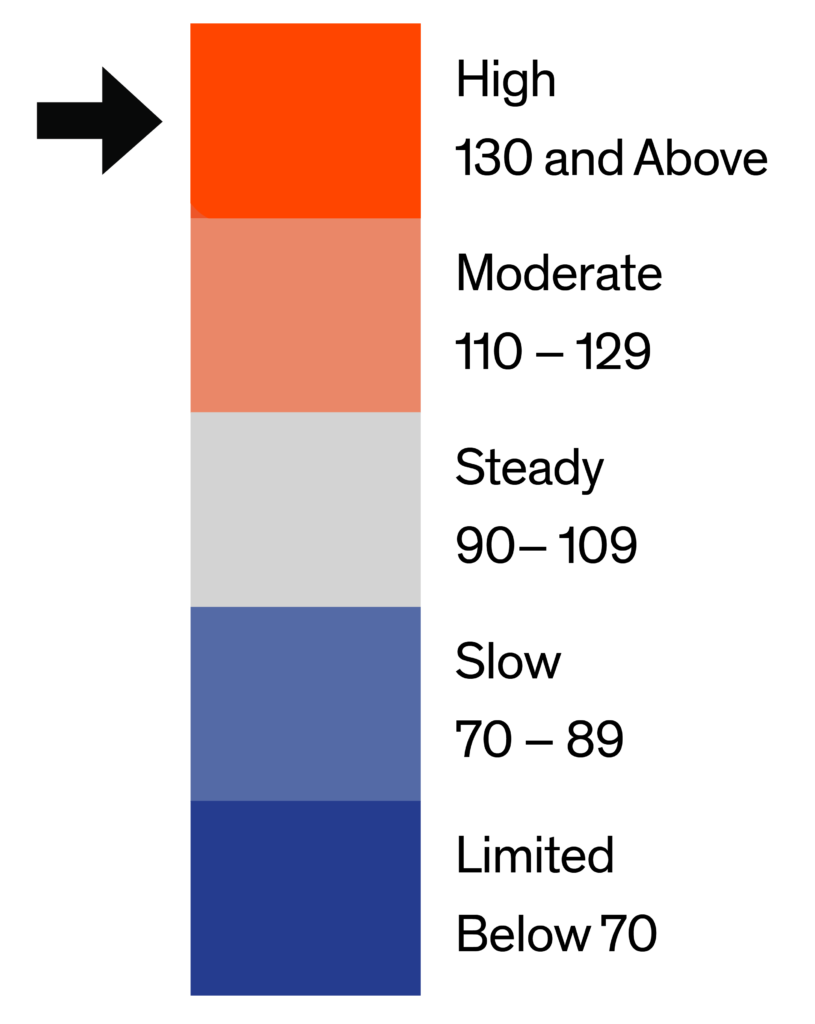
The Bright MLS | T3 Home Demand Index for the Baltimore Metro area fell in December, down by slightly more than 25 percent compared with the November reading. The Index, at 73, reflected a Slow pace of demand for homes and a decrease in buyer interest from a Moderate pace the month before. The December Index was 17 percent lower than one year earlier.
In December, demand fell for each type of home with the largest month-to-month decline in the mid-priced and higher-priced single-family segments. Lower-priced single-family homes and lower-priced condos exhibited the weakest demand. The higher-priced condo segment was the only type of Baltimore Metro area home to record a High level of buyer interest. The months supply of inventory was flat, or down, for each home type mostly due to a decline in the number of listings. The months supply ranged from 0.9 months for mid-priced single-family homes to 2.3 months for higher-priced condos.

Monthly Statistics for January 2022
Home Demand
Index
Index
73
(Slow)
Home Demand Index
from prior month
from prior month
98
Home Demand Index
from prior year
from prior year
88
Index change
from prior month
from prior month
-25.5%
Index change from
same time last year
same time last year
-17%
Bright MLS | T3 Home Demand Index
www.homedemandindex.com
Baltimore | January 2022
Home Demand Index | Historical Year-over-Year Comparison
Demand for homes in the Baltimore Metro area decreased in November and December following several months in the summer and fall when buyer interest held at a Moderate pace. The decline in the Index of nearly 40 percent since October was consistent with the decrease in buyer demand one year earlier. Headed into 2022, demand is at a lower level than last year due to the continued increase in home prices, reduced affordability and low inventory, which has curbed buyers in their search for homes.
Home Demand Index
Bright MLS | T3 Home Demand Index
www.homedemandindex.com
Baltimore | January 2022
Home Demand Map
In the Baltimore Metro area, buyer demand remained High in Howard County and at a Moderate level in Baltimore County. Demand was Steady in Harford and Anne Arundel counties and Slow in Carroll County and Baltimore City. In the Greater Baltimore area, buyer interest was Steady in the Maryland Eastern Shore region and the DelMar Coastal area. Slightly fewer than half of ZIP codes across the entire region were in the High or Moderate demand category, which was virtually unchanged from November. One-quarter of ZIP codes had Limited demand, the same as the previous month.
Bright MLS | T3 Home Demand Index
www.homedemandindex.com
Baltimore | January 2022
Demand and Inventory by Home Type
In December, demand fell for each type of home with the largest month-to-month decline in the mid-priced and higher-priced single-family segments. Lower-priced single-family homes and lower-priced condos exhibited the weakest demand. The higher-priced condo segment was the only type of Baltimore Metro area home to record a High level of buyer interest. The months supply of inventory was flat, or down, for each home type mostly due to a decline in the number of listings. The months supply ranged from 0.9 months for mid-priced single-family homes to 2.3 months for higher-priced condos.
Bright MLS | T3 Home Demand Index
www.homedemandindex.com
Baltimore | January 2022
Single Family Home Below $250k
In December, the Bright MLS | T3 Home Demand Index for lower-priced single-family homes continued a months-long decline. The Index, at 34, remained in the Limited demand range and was more than one-third lower than one year earlier. The months supply fell to 1.2 from 1.5 months in November, suggesting that there was little inventory to choose from for buyers in this price range even with weak demand.

Monthly Statistics for Single Family Home Below $250k
Home Demand
Index
Index
34
(Limited)
Home Demand Index
from prior month
from prior month
44
Home Demand Index
from prior year
from prior year
56
Months of
inventory
inventory
1.2
Average daily inventory last month
261
Inventory sold
last month
last month
214
Bright MLS | T3 Home Demand Index
www.homedemandindex.com
Baltimore | January 2022
Single Family Home $250k - $590k
Buyer interest in mid-priced single-family homes decreased from Steady to Slow over the month. The Index, at 79, fell 28 percent in December but was just 10 percent below the level one year earlier. Despite the reduced demand, the inventory of homes available for sale was very low. The months supply in December, at 0.9, was down from 1.3 months in November.

Monthly Statistics for Single Family Home $250k - $590k
Home Demand
Index
Index
79
(Slow)
Home Demand Index
from prior month
from prior month
109
Home Demand Index
from prior year
from prior year
88
Months of
Inventory
Inventory
0.9
Average daily inventory last month
1,074
Inventory sold
last month
last month
1,157
Bright MLS | T3 Home Demand Index
www.homedemandindex.com
Baltimore | January 2022
Single Family Home Above $590k
Although Steady in December, demand for higher-priced single-family homes decreased more than any Baltimore Metro area home type to an Index level of 100. Although demand fell 30 percent, the Index was only two percent lower than one year earlier, suggesting that most of the decline is attributable to the usual seasonal slowdown in buyer interest. The months supply was just 1.1 in December, down from 1.5 the previous month.

Monthly Statistics for Single Family Home Above $590k
Home Demand
Index
Index
100
(Steady)
Home Demand Index
from prior month
from prior month
143
Home Demand Index
from prior year
from prior year
102
Months of
Inventory
Inventory
1.1
Average daily inventory last month
440
Inventory sold
last month
last month
389
Bright MLS | T3 Home Demand Index
www.homedemandindex.com
Baltimore | January 2022
Condo Below $310k
Demand for lower-priced condos remained in the Slow range despite a decrease of 17 percent in the Index over the month. Compared to one year earlier, demand was down by 25 percent. The months supply was 1.3, virtually unchanged from November. Since spring, the months supply has moved in a narrow range between one month and 1.3 months.

Monthly Statistics for Condo Below $310k
Home Demand
Index
Index
74
(Slow)
Home Demand Index
from prior month
from prior month
89
Home Demand Index
from prior year
from prior year
99
Months of
Inventory
Inventory
1.3
Average daily inventory last month
208
Inventory sold
last month
last month
165
Bright MLS | T3 Home Demand Index
www.homedemandindex.com
Baltimore | January 2022
Condo Above $310k
Among all types of Baltimore Metro area homes, higher-priced condos recorded the strongest demand in December. The Index remained in the High range, at 175, although down 20 percent from the previous month. Compared with one year earlier, demand was nearly one-third higher. The months supply at 2.3 was down from 2.9 months in November.

Monthly Statistics for Condo Above $310k
Home Demand
Index
Index
175
(High)
Home Demand Index
from prior month
from prior month
220
Home Demand Index
from prior year
from prior year
134
Months of
Inventory
Inventory
2.3
Average daily inventory last month
145
Inventory sold
last month
last month
62
Bright MLS | T3 Home Demand Index
www.homedemandindex.com
Baltimore | January 2022
Townhouse/Rowhouse/Twin All prices
Townhouse/
Rowhouse/Twin
All prices
Demand for townhouses eased from Steady to Slow over the month. The Bright MLS | T3 Home Demand Index, at 82, was down by 23 percent over the month. Inventory continued to be very lean with a months supply of just 1.3 in December, down marginally from the previous month.

Monthly Statistics for Townhouse/Rowhouse/TwinAll prices
Home Demand
Index
Index
82
(Slow)
Home Demand Index
from prior month
from prior month
107
Home Demand Index
from prior year
from prior year
99
Months of
Inventory
Inventory
1.3
Average daily inventory last month
1,948
Inventory sold
last month
last month
1,512
Bright MLS | T3 Home Demand Index
www.homedemandindex.com
Note
1. This report is generated with data from the following counties:
- Baltimore Metro – Anne Arundel, MD; Baltimore City, MD; Baltimore, MD; Carroll, MD; Harford, MD; Howard, MD;
- DelMar Coastal – Somerset, MD; Sussex, DE; Wicomico, MD; Worcester, MD;
- Maryland Eastern Shore – Caroline, MD; Cecil, MD; Dorchester, MD; Kent, MD; Queen Annes, MD; Talbot, MD;
2. This report is for the January 2022 period with data collected from the previous month.
Released: January 11, 2022
Reference ID: 1546
Baltimore | January 2022
Home Demand Map (Zip Codes)
In the Baltimore Metro area, buyer demand remained High in Howard County and at a Moderate level in Baltimore County. Demand was Steady in Harford and Anne Arundel counties and Slow in Carroll County and Baltimore City. In the Greater Baltimore area, buyer interest was Steady in the Maryland Eastern Shore region and the DelMar Coastal area. Slightly fewer than half of ZIP codes across the entire region were in the High or Moderate demand category, which was virtually unchanged from November. One-quarter of ZIP codes had Limited demand, the same as the previous month.

Bright MLS | T3 Home Demand Index
www.homedemandindex.com