August 2023 Report
Washington D.C. Metro
Washington D.C. | August 2023
Home Demand Index
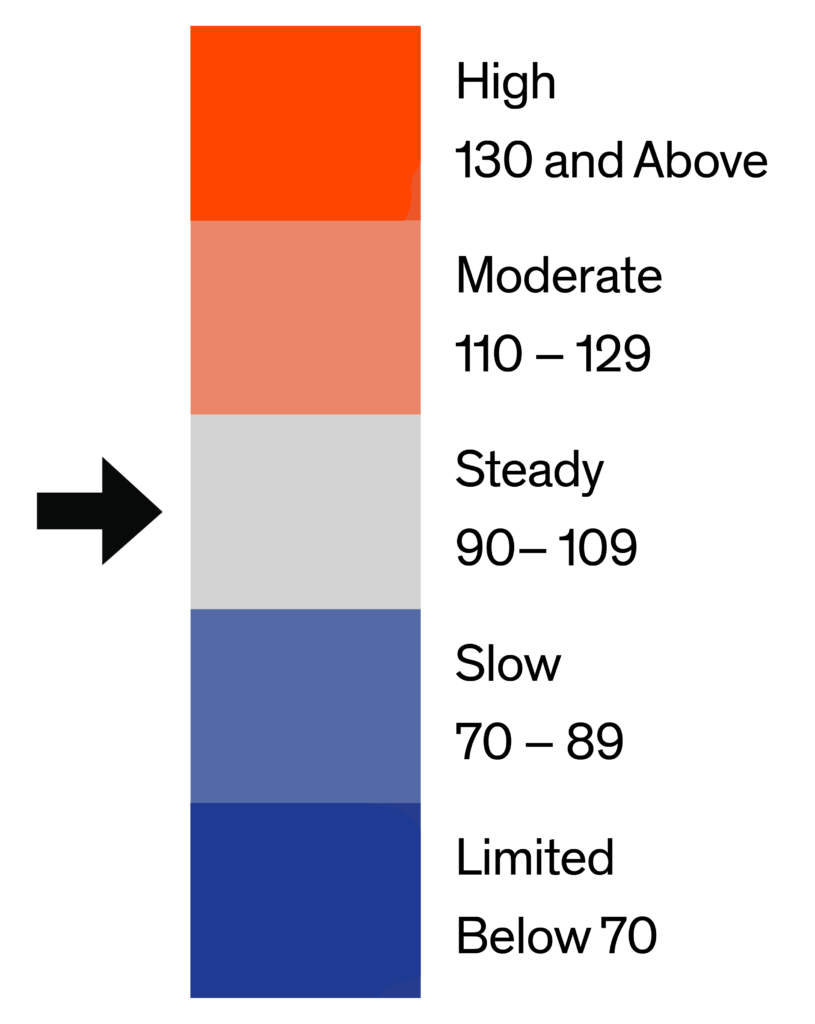
Demand for Washington Metro area homes fell in July according to the Bright MLS | T3 Home Demand Index. The Index was 11 percent lower over the month and reflected a Slow pace of buyer activity. The Index was 26.4 percent lower than one year earlier when demand was in the Moderate category.
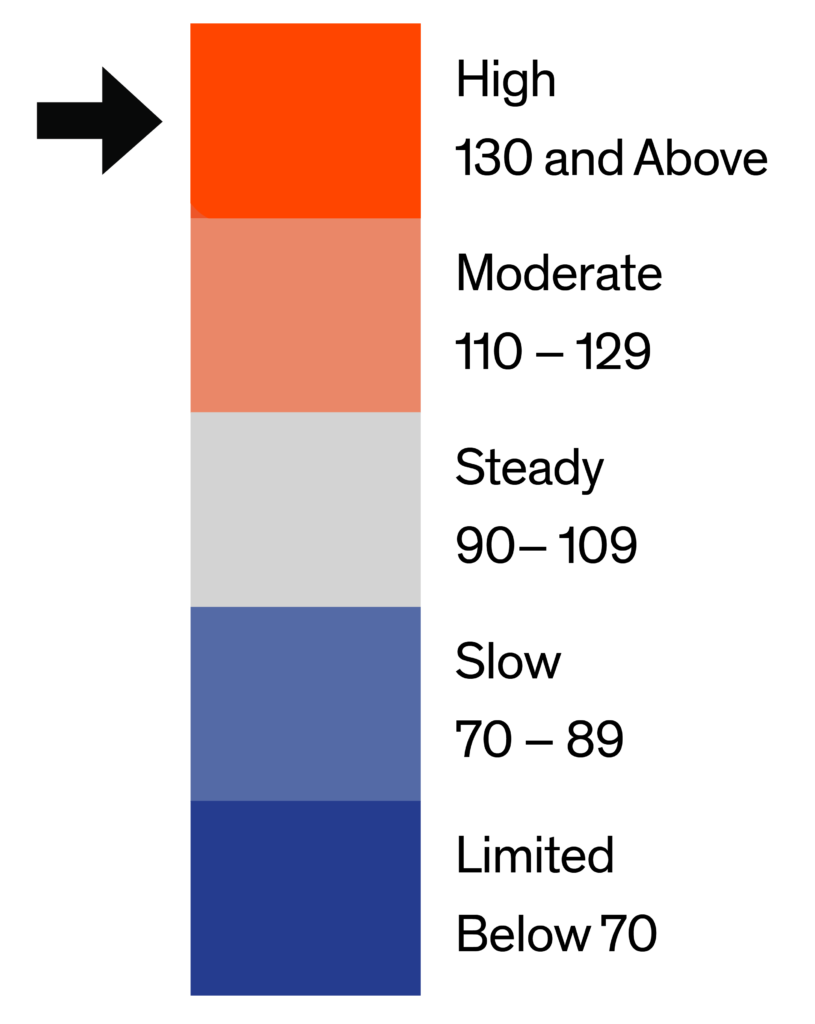
Buyer interest in all types of homes fell in July. The Index for luxury single-family homes decreased the most, falling by 15 percent, followed by a 13 percent decline for mid-market single-family homes. Demand remained strongest for luxury condos, which attracted a High level of buyer interest, followed by luxury single-family homes with Steady demand. Demand was weakest for entry-level and mid-market single-family homes, each with buyer interest in the Slow range. The inventory of homes available for sales remained very low in July. The months supply did increase for each type of home, however, due to lower sales and little change in the number of listings on the market. The months supply ranged from 1.3 months for mid-market single-family homes to 3.4 months for luxury condos.

Monthly Statistics for August 2023
Home Demand
Index
Index
81
(Slow)
Home Demand Index
from prior month
from prior month
91
Home Demand Index
from prior year
from prior year
110
Index change
from prior month
from prior month
-11%
Index change from
same time last year
same time last year
-26.4%
Bright MLS | T3 Home Demand Index
www.homedemandindex.com
Washington D.C. | August 2023
Home Demand Index | Historical Year-over-Year Comparison
Buyer interest in Washington Metro area homes fell for the third consecutive month after reaching a seasonal peak in April. The July decrease was greater than the previous two monthly declines. Higher mortgage rates and continued home price gains have reduced affordability. Moreover, low inventory levels contributed to the decrease by limiting the number of home sales.
Home Demand Index
Bright MLS | T3 Home Demand Index
www.homedemandindex.com
Washington D.C. | August 2023
Home Demand Map
Demand was High in Alexandria City, Moderate in Arlington County and Steady in Falls Church City. Buyer interest was in the Slow or Limited range in the rest of the Washington Metro area. Demand was Moderate in Southern Maryland and the Maryland-West Virginia Panhandle market areas and Slow in the North Central Virginia region. Across the Greater Washington area, demand in one-quarter of ZIP codes was in the High or Moderate categories, down slightly from June. Demand in 58 percent of ZIP codes was either Slow or Limited, an increase from half of communities in June.
Bright MLS | T3 Home Demand Index
www.homedemandindex.com
Washington D.C. | August 2023
Demand and Inventory by Home Type
Buyer interest in all types of homes fell in July. The Index for luxury single-family homes decreased the most, falling by 15 percent, followed by a 13 percent decline for mid-market single-family homes. Demand remained strongest for luxury condos, which attracted a High level of buyer interest, followed by luxury single-family homes with Steady demand. Demand was weakest for entry-level and mid-market single-family homes, each with buyer interest in the Slow range. The inventory of homes available for sales remained very low in July. The months supply did increase for each type of home, however, due to lower sales and little change in the number of listings on the market. The months supply ranged from 1.3 months for mid-market single-family homes to 3.4 months for luxury condos.
Bright MLS | T3 Home Demand Index
www.homedemandindex.com
Washington D.C. | August 2023
Single Family Home Below $510k
Demand for entry-level single-family homes was virtually unchanged in July. The Index, at 72, continued to reflect a Slow pace of buyer interest and was 25 percent lower than one year earlier. The gap over the past year reflects the cumulative impact of market headwinds, which have limited the pace of sales amid a shortage of inventory. In July, there was a 1.8 months supply of homes for sale, up from 1.4 months in June.

Monthly Statistics for Single Family Home Below $510k
Home Demand
Index
Index
72
(Slow)
Home Demand Index
from prior month
from prior month
73
Home Demand Index
from prior year
from prior year
96
Months of
inventory
inventory
1.8
Average daily inventory last month
663
Inventory sold
last month
last month
368
Bright MLS | T3 Home Demand Index
www.homedemandindex.com
Washington D.C. | August 2023
Single Family Home $510k - $1200k
The Bright MLS | T3 Home Demand Index for mid-market single-family homes fell 13 percent in July but remained in the Slow category. The Index was one-third lower than a year earlier, the largest year-earlier gap among metro area home types. Inventory conditions remained very challenging with just 1.3 months supply, a lower level of supply relative to sales than any other segment of the Washington Metro area market.

Monthly Statistics for Single Family Home $510k - $1200k
Home Demand
Index
Index
74
(Slow)
Home Demand Index
from prior month
from prior month
85
Home Demand Index
from prior year
from prior year
110
Months of
Inventory
Inventory
1.3
Average daily inventory last month
1,392
Inventory sold
last month
last month
1,101
Bright MLS | T3 Home Demand Index
www.homedemandindex.com
Washington D.C. | August 2023
Single Family Home Above $1200k
Demand for luxury homes fell in July with the Index retreating by 15 percent to 107, a level consistent with Steady buyer activity. Despite the relatively high price point, demand for homes in this segment was stronger than other lower-priced single-family segments. The months supply, at 2.2 months, was up from an even leaner 1.8 months in June.

Monthly Statistics for Single Family Home Above $1200k
Home Demand
Index
Index
107
(Steady)
Home Demand Index
from prior month
from prior month
126
Home Demand Index
from prior year
from prior year
132
Months of
Inventory
Inventory
2.2
Average daily inventory last month
693
Inventory sold
last month
last month
313
Bright MLS | T3 Home Demand Index
www.homedemandindex.com
Washington D.C. | August 2023
Condo Below $560k
The Bright MLS | T3 Home Demand Index for entry-level condos, at 93, was 11 percent lower in July but, even with the decline, continued to reflect a Steady level of buyer interest. The inventory, equivalent to a 1.9 months supply, was up from just 1.5 months in June largely due to a slowdown in sales over the month.

Monthly Statistics for Condo Below $560k
Home Demand
Index
Index
93
(Steady)
Home Demand Index
from prior month
from prior month
104
Home Demand Index
from prior year
from prior year
120
Months of
Inventory
Inventory
1.9
Average daily inventory last month
1,253
Inventory sold
last month
last month
670
Bright MLS | T3 Home Demand Index
www.homedemandindex.com
Washington D.C. | August 2023
Condo Above $560k
Demand for luxury condos was down marginally in July and remained in the High category. The Index, at 133, was 6 percent lower than June and just 8 percent below the year-earlier level. The relatively small decrease compared with the year before suggests that demand for luxury condos has been resilient in the face of numerous market headwinds. The months supply, at 3.4, was up from 2.8 months in June.

Monthly Statistics for Condo Above $560k
Home Demand
Index
Index
133
(High)
Home Demand Index
from prior month
from prior month
141
Home Demand Index
from prior year
from prior year
145
Months of
Inventory
Inventory
3.4
Average daily inventory last month
410
Inventory sold
last month
last month
122
Bright MLS | T3 Home Demand Index
www.homedemandindex.com
Washington D.C. | August 2023
Townhouse/Rowhouse/Twin All prices
Townhouse/
Rowhouse/Twin
All prices
Buyer interest in townhouses was lower in July with the Index decreasing 11 percent to 81, a level consistent with a Slow pace of demand. The Index was 28 percent lower than one year earlier, with only mid-market single-family homes recording a larger year-to-year gap. The months supply rose from 1.3 months to 1.7 months in July.

Monthly Statistics for Townhouse/Rowhouse/TwinAll prices
Home Demand
Index
Index
81
(Slow)
Home Demand Index
from prior month
from prior month
91
Home Demand Index
from prior year
from prior year
112
Months of
Inventory
Inventory
1.7
Average daily inventory last month
1,896
Inventory sold
last month
last month
1,138
Bright MLS | T3 Home Demand Index
www.homedemandindex.com
Note
1. This report is generated with data from the following counties:
- Maryland-West Virginia Panhandle – Allegany, MD; Berkeley, WV; Garrett, MD; Grant, WV; Hampshire, WV; Hardy, WV; Jefferson, WV; Mineral, WV; Morgan, WV; Pendleton, WV; Washington, MD;
- North Central Virginia – Caroline, VA; Clarke, VA; Culpeper, VA; Fauquier, VA; Frederick, VA; Fredericksburg City, VA; King George, VA; Madison, VA; Manassas City, VA; Orange, VA; Page, VA; Prince William, VA; Rappahannock, VA; Shenandoah, VA; Spotsylvania, VA; Stafford, VA; Warren, VA; Winchester City, VA;
- Southern Maryland – Calvert, MD; Charles, MD; Saint Marys, MD;
- Washington D.C. Metro – Alexandria City, VA; Arlington, VA; Fairfax, VA; Falls Church City, VA; Frederick, MD; Loudoun, VA; Montgomery, MD; Prince Georges, MD; Washington, DC;
2. This report is for the August 2023 period with data collected from the previous month.
Released: August 10, 2023
Reference ID: 1877
Washington D.C. | August 2023
Home Demand Map (Zip Codes)
Demand was High in Alexandria City, Moderate in Arlington County and Steady in Falls Church City. Buyer interest was in the Slow or Limited range in the rest of the Washington Metro area. Demand was Moderate in Southern Maryland and the Maryland-West Virginia Panhandle market areas and Slow in the North Central Virginia region. Across the Greater Washington area, demand in one-quarter of ZIP codes was in the High or Moderate categories, down slightly from June. Demand in 58 percent of ZIP codes was either Slow or Limited, an increase from half of communities in June.

Bright MLS | T3 Home Demand Index
www.homedemandindex.com