May 2024 Report
Baltimore Metro
Baltimore | May 2024
Home Demand Index
As of May 2024, the Baltimore Metro area exhibits a tempered real estate market with the Bright MLS | T3 Home Demand Index standing at 88. This figure represents a decrease from the previous month’s index of 90 and a significant drop from the prior year’s index of 99. This trend indicates a subtle yet persistent softening of market dynamics, influenced by fluctuating economic conditions and buyer sentiment.
Baltimore’s housing market in May 2024 demonstrated a solid increase in demand for mid to high-priced single-family homes, with a particularly strong interest in the condo market. The demand indices for these home types rose considerably, suggesting a vibrant buying activity. The inventory constraints continued to pose challenges, keeping the market tight and competitive. This robust demand, coupled with low supply, points to a dynamic market environment where buyers are eager to secure properties in higher price brackets.

Monthly Statistics for May 2024
Home Demand
Index
Index
88
(Slow)
Home Demand Index
from prior month
from prior month
90
Home Demand Index
from prior year
from prior year
99
Index change
from prior month
from prior month
-2.2%
Index change from
same time last year
same time last year
-11.1%
Bright MLS | T3 Home Demand Index
www.homedemandindex.com
Baltimore | May 2024
Home Demand Index | Historical Year-over-Year Comparison
From May 2023 to April 2024, Baltimore’s Home Demand Index (HDI) illustrates a a dip and substantial recovery in the housing market. Starting in the “Steady” range, the HDI dropped through late 2023 and from January 2024 had a resurgence indicating growing buyer activity. By April 2024, the index nearly returned to the Steady levels as seen in last year’s summer levels, showcasing a resilient market. As it stands, the market is hovering between Steady and Limited Index as we approach the Summer months.
Home Demand Index
Bright MLS | T3 Home Demand Index
www.homedemandindex.com
Baltimore | May 2024
Home Demand Map
In the Baltimore Metro area, the HDI of 88 also places it in the “Slow” category, reflecting subdued market activity. The surrounding areas display varied market strengths; the Maryland Eastern Shore has a healthier market condition with an HDI of 99, ranked as “Steady,” which means the activity is substantially the same as the baseline period in 2019. The DelMar Coastal area outperforms other regions with an HDI of 114, categorized as “Moderate,” indicating a healthy level of consumer pre-sales activity.
Bright MLS | T3 Home Demand Index
www.homedemandindex.com
Baltimore | May 2024
Demand and Inventory by Home Type
Baltimore’s housing market in May 2024 demonstrated a solid increase in demand for mid to high-priced single-family homes, with a particularly strong interest in the condo market. The demand indices for these home types rose considerably, suggesting a vibrant buying activity. The inventory constraints continued to pose challenges, keeping the market tight and competitive. This robust demand, coupled with low supply, points to a dynamic market environment where buyers are eager to secure properties in higher price brackets.
Bright MLS | T3 Home Demand Index
www.homedemandindex.com
Baltimore | May 2024
Single Family Home Below $348k
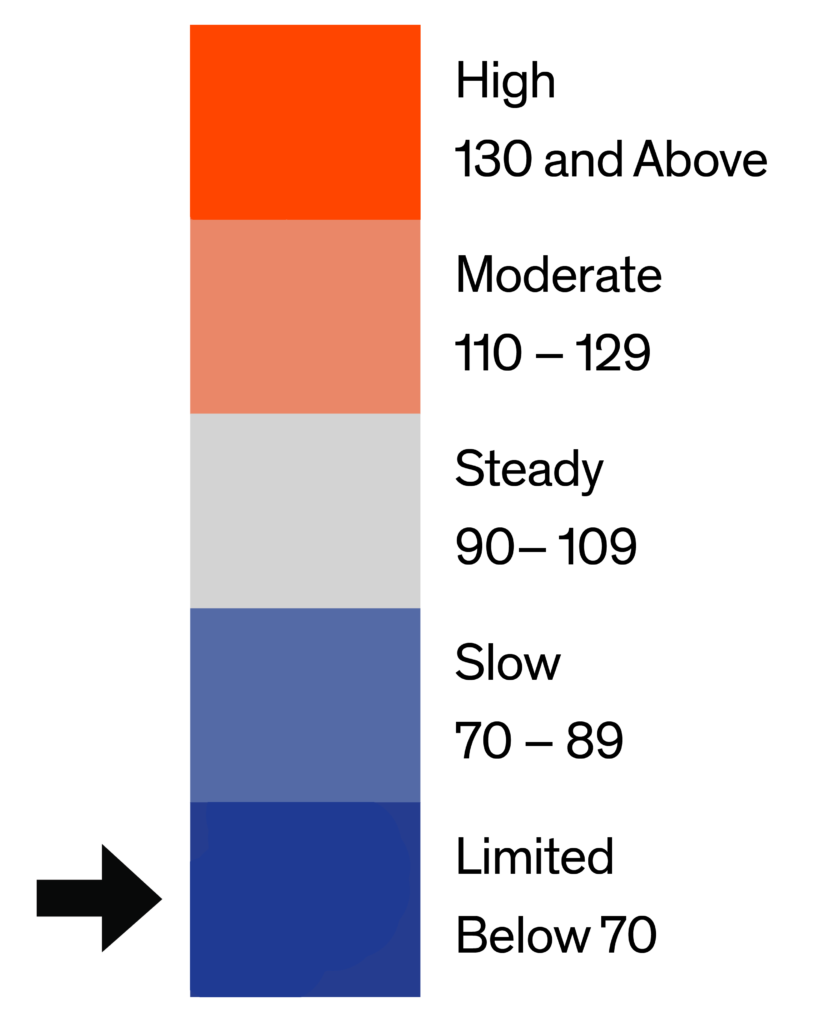
The index for single-family homes priced below $348k stands at 66, reflecting a decrease from the previous month’s index of 74 and last year’s index of 83. This segment shows a cooling trend, potentially due to a tightening of inventory and rising interest rates affecting affordability. This housing segment has had relatively low demand compared to other housing price bands for all of 2024.

Monthly Statistics for Single Family Home Below $348k
Home Demand
Index
Index
66
(Limited)
Home Demand Index
from prior month
from prior month
74
Home Demand Index
from prior year
from prior year
83
Months of
inventory
inventory
1.4
Average daily inventory last month
366
Inventory sold
last month
last month
261
Bright MLS | T3 Home Demand Index
www.homedemandindex.com
Baltimore | May 2024
Single Family Home $348k - $795k
Middle-tier single-family homes, priced between $348k and $795k, maintain an index of 88, showing relative stability from the previous month’s 86 but a slight decline from the previous year’s 96. This segment represents a balanced part of the market with steady demand. The housing in this price band has had relatively steady demand in 2024, but still well below the highest price category.

Monthly Statistics for Single Family Home $348k - $795k
Home Demand
Index
Index
88
(Slow)
Home Demand Index
from prior month
from prior month
86
Home Demand Index
from prior year
from prior year
96
Months of
Inventory
Inventory
1.3
Average daily inventory last month
877
Inventory sold
last month
last month
683
Bright MLS | T3 Home Demand Index
www.homedemandindex.com
Baltimore | May 2024
Single Family Home Above $795k
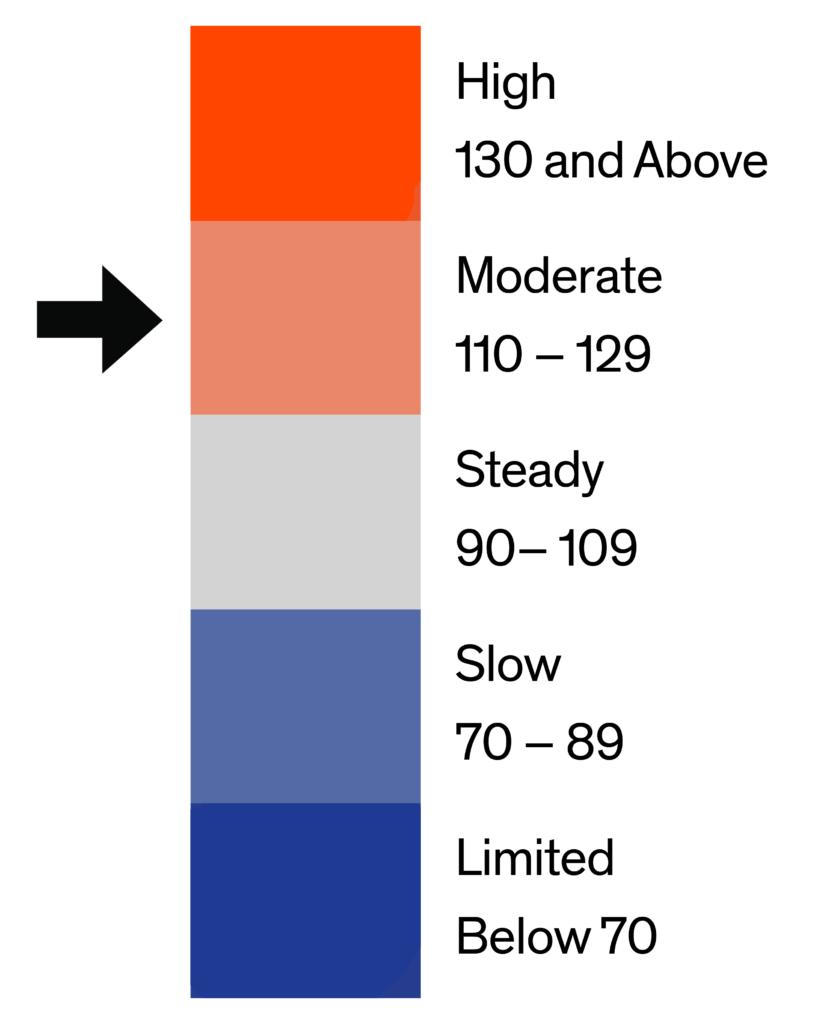
The high-end market for single-family homes above $795k shows a robust index of 114, up from 95 the previous month and slightly down from 117 last year. This increase suggests a sustained interest from affluent buyers, possibly driven by luxury market dynamics and investment trends. This housing segment has consistently experienced increasing demand throughout 2024. The months supply, at 1.9 months, was down from 2.4 months in March.

Monthly Statistics for Single Family Home Above $795k
Home Demand
Index
Index
114
(Moderate)
Home Demand Index
from prior month
from prior month
95
Home Demand Index
from prior year
from prior year
117
Months of
Inventory
Inventory
1.9
Average daily inventory last month
386
Inventory sold
last month
last month
205
Bright MLS | T3 Home Demand Index
www.homedemandindex.com
Baltimore | May 2024
Condo Below $396k
Condos priced below $396k exhibit an index of 104, down from 112 the previous month and from 109 the previous year. This segment is experiencing a moderate slowdown, reflecting broader market conditions impacting the affordability for first-time buyers. This segment maintains at a Steady level buyer interest. The months supply of homes, at 1.5 months, was down from 1.8 months in March.

Monthly Statistics for Condo Below $396k
Home Demand
Index
Index
104
(Steady)
Home Demand Index
from prior month
from prior month
112
Home Demand Index
from prior year
from prior year
109
Months of
Inventory
Inventory
1.5
Average daily inventory last month
257
Inventory sold
last month
last month
174
Bright MLS | T3 Home Demand Index
www.homedemandindex.com
Baltimore | May 2024
Condo Above $396k
Higher-end condos, priced above $396k, have an index of 118, slightly down from the previous month’s 123 and is 27% down the previous year’s 162. Despite the slight decrease, this segment continues to attract a significant number of buyers, likely due to a combination of luxury amenities and strategic locations. Buyer interest in this segment remains at a Moderate level. The months of supply increased to 2.6 from 2.4 in March.

Monthly Statistics for Condo Above $396k
Home Demand
Index
Index
118
(Moderate)
Home Demand Index
from prior month
from prior month
123
Home Demand Index
from prior year
from prior year
162
Months of
Inventory
Inventory
2.6
Average daily inventory last month
84
Inventory sold
last month
last month
33
Bright MLS | T3 Home Demand Index
www.homedemandindex.com
Baltimore | May 2024
Townhouse/Rowhouse/Twin All prices
Townhouse/
Rowhouse/Twin
All prices
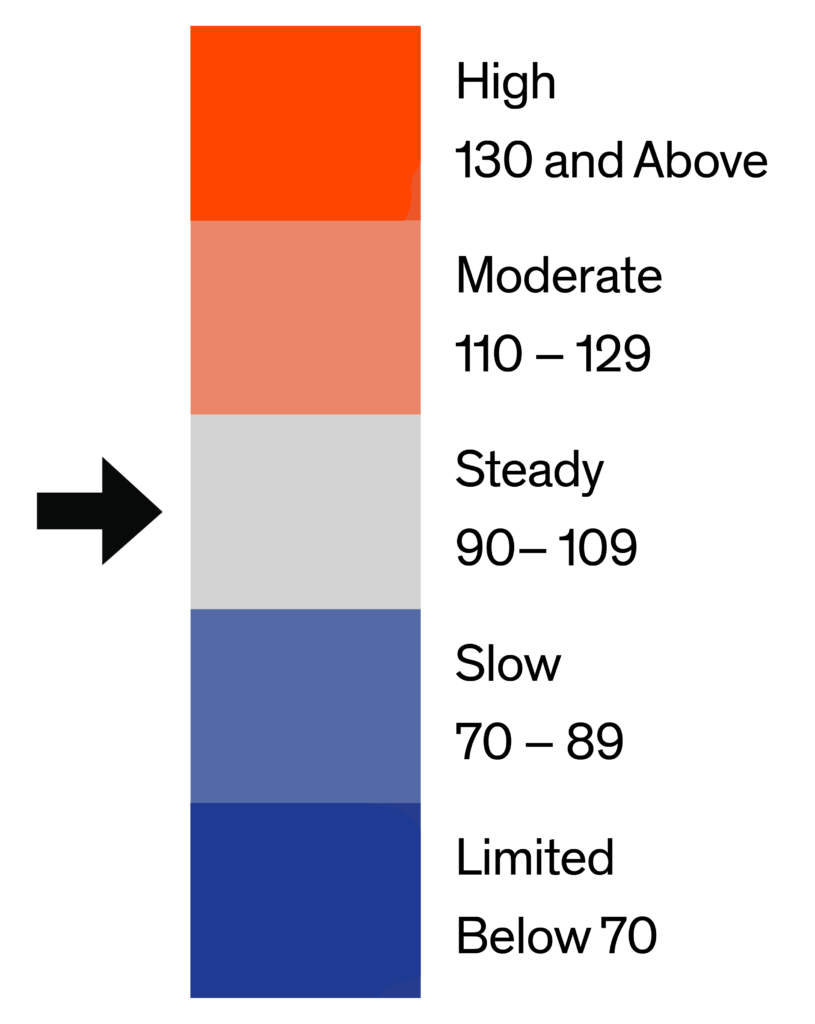
The index for townhouses, rowhouses, and twins was down at 90, reflecting a decrease from the previous month’s index of 95. The index was 14% lower compared with one year earlier. These home types continue to maintain steady interest from buyers, likely due to their affordability and appeal to a broad demographic spectrum. The months supply at 1.9, was marginally lower than the previous months.

Monthly Statistics for Townhouse/Rowhouse/TwinAll prices
Home Demand
Index
Index
90
(Steady)
Home Demand Index
from prior month
from prior month
95
Home Demand Index
from prior year
from prior year
105
Months of
Inventory
Inventory
1.9
Average daily inventory last month
1,949
Inventory sold
last month
last month
1,034
Bright MLS | T3 Home Demand Index
www.homedemandindex.com
Note
1. This report is generated with data from the following counties:
- Baltimore Metro – Anne Arundel, MD; Baltimore City, MD; Baltimore, MD; Carroll, MD; Harford, MD; Howard, MD;
- DelMar Coastal – Somerset, MD; Sussex, DE; Wicomico, MD; Worcester, MD;
- Maryland Eastern Shore – Caroline, MD; Cecil, MD; Dorchester, MD; Kent, MD; Queen Annes, MD; Talbot, MD;
2. This report is for the May 2024 period with data collected from the previous month.
Released: May 11, 2024
Reference ID: 2035
Baltimore | May 2024
Home Demand Map (Zip Codes)
In the Baltimore Metro area, the HDI of 88 also places it in the “Slow” category, reflecting subdued market activity. The surrounding areas display varied market strengths; the Maryland Eastern Shore has a healthier market condition with an HDI of 99, ranked as “Steady,” which means the activity is substantially the same as the baseline period in 2019. The DelMar Coastal area outperforms other regions with an HDI of 114, categorized as “Moderate,” indicating a healthy level of consumer pre-sales activity.

Bright MLS | T3 Home Demand Index
www.homedemandindex.com