Baltimore Metro
Metro Area Overview
Market Trend Map
Metro Area Overview
The Home Demand Index (HDI) for Baltimore stands at 75 this report period, reflecting an increase from last month’s 68 but a decline from last year’s 83. This upward movement suggests a strengthening in buyer activity compared to the previous month, though demand remains lower than the same period last year. Market conditions continue to be influenced by affordability constraints and inventory challenges.
The market trend line, below, provides a high-level monthly overview of the Home Demand Index for each of the metro market areas within the Greater Baltimore Metro Area. The Home Demand Index is baselined at 100, with 90-110 indicating a steady market. Index values above 110 indicate moderate and high activity while Index values below 90 indicate slower or limited activity. For more information for a given period of time, click on any point on the map to pull up the monthly report.

Metro Market Trend Data by Bright MLS | T3 Home Demand Index
Each of the market areas listed above are defined as follows:
- Baltimore Metro – Anne Arundel, MD; Baltimore City, MD; Baltimore, MD; Carroll, MD; Harford, MD; Howard, MD;
- DelMar Coastal – Somerset, MD; Sussex, DE; Wicomico, MD; Worcester, MD;
- Maryland Eastern Shore – Caroline, MD; Cecil, MD; Dorchester, MD; Kent, MD; Queen Annes, MD; Talbot, MD;
Market Trend Map
The Market Trend Map for the Baltimore Metro pulls the county map from the monthly reports and combines to provide a time-lapse of the overall market. Use the navigation at the bottom to toggle between months.
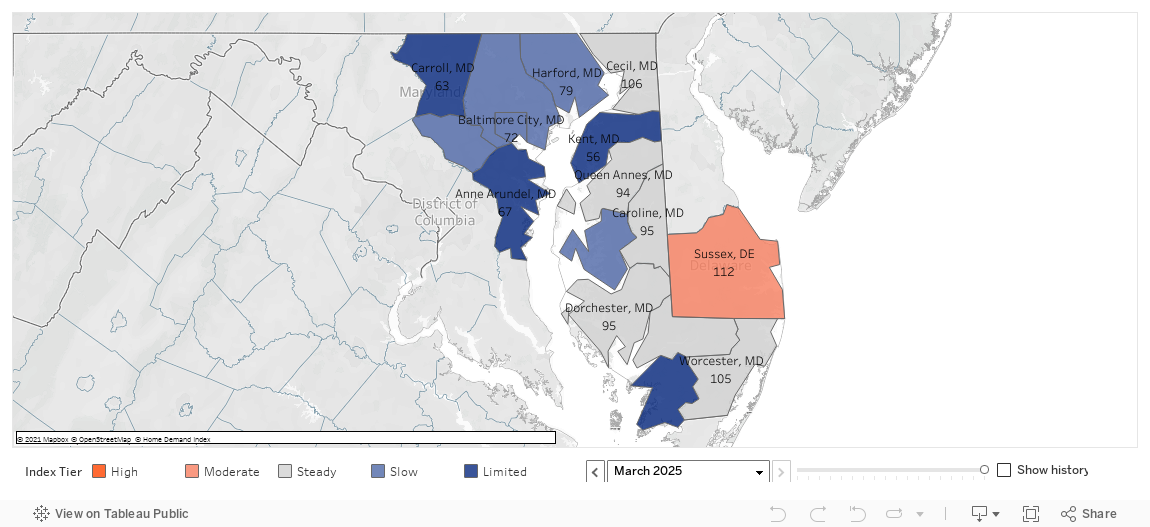
Baltimore Metro County-Level Market Trend Map | Home Demand Index
Current Market Report
Last 6 Market Reports
Historical Market Reports
Data Download
Baltimore | March 2025
Home Demand Index
The Home Demand Index (HDI) for Baltimore stands at 75 this report period, reflecting an increase from last month’s 68 but a decline from last year’s 83. This upward movement suggests a strengthening in buyer activity compared to the previous month, though demand remains lower than the same period last year. Market conditions continue to be influenced by affordability constraints and inventory challenges.
Entry-level single-family homes have experienced a modest increase in demand, driven by affordability constraints and limited inventory. Mid-market single-family homes saw a 10% rise in demand, suggesting improved buyer confidence. Luxury single-family homes exhibited the strongest growth, with a 31% increase, possibly fueled by shifting investment preferences. Entry-level condos have maintained steady demand, with competition persisting due to tight supply. Luxury condos continue to see heightened demand, reinforcing the overall trend of increased buyer activity across property types.

Monthly Statistics for March 2025
Home Demand
Index
Index
75
(Slow)
Home Demand Index
from prior month
from prior month
68
Home Demand Index
from prior year
from prior year
83
Index change
from prior month
from prior month
10.3%
Index change from
same time last year
same time last year
-9.6%
Bright MLS | T3 Home Demand Index
www.homedemandindex.com
Baltimore | February 2025
Home Demand Index
The Home Demand Index (HDI) for Baltimore stands at 66 this report period, marking an increase from last month’s 56 but a slight decline from last year’s 69. This rebound suggests a modest resurgence in buyer interest following last month’s dip, though demand remains softer compared to the same period last year. Ongoing economic factors, including affordability constraints and inventory challenges, continue to shape market conditions.
Entry-level single-family homes have seen a modest increase in demand. Mid-market single-family homes have experienced a 16% increase, while luxury single-family homes have grown by 31%. Entry-level condos have shifted from limited to steady demand, with inventory constraints still driving competition. Luxury condos have exhibited the largest increase in demand, moving from slow to moderate demand. Overall, the market is experiencing an uptick in demand across all property types, though supply constraints continue to shape trends.

Monthly Statistics for February 2025
Home Demand
Index
Index
66
(Limited)
Home Demand Index
from prior month
from prior month
56
Home Demand Index
from prior year
from prior year
69
Index change
from prior month
from prior month
17.9%
Index change from
same time last year
same time last year
-4.3%
Bright MLS | T3 Home Demand Index
www.homedemandindex.com
Baltimore | January 2025
Home Demand Index
The Home Demand Index (HDI) for Baltimore stands at 55 this report period, a sharp decrease from last month’s 74 and slightly below last year’s 56. This decline indicates a significant cooling in buyer activity compared to the previous month, reflecting a subdued market environment. Persistent inventory constraints and fluctuating economic conditions continue to shape the market dynamics.
Entry-level single-family homes show stagnant demand, constrained by affordability challenges and low inventory. Luxury condos maintain the highest buyer interest, though demand has slightly cooled from the previous month. Mid-market and luxury single-family homes reflect the most significant declines, while entry-level condos shifted from slow to limited demand. Townhouses also moved from slow to limited demand. Overall, during this report period, the housing market is experiencing a decline in demand, leading to mixed market conditions across various home types.
Monthly Statistics for January 2025
Home Demand
Index
Index
55
(Limited)
Home Demand Index
from prior month
from prior month
74
Home Demand Index
from prior year
from prior year
56
Index change
from prior month
from prior month
-25.7%
Index change from
same time last year
same time last year
-1.8%
Bright MLS | T3 Home Demand Index
www.homedemandindex.com
Baltimore | December 2024
Home Demand Index
The Home Demand Index (HDI) for Baltimore stands at 73 this report period, a slight decrease from 74 last month but an increase from 67 a year ago. This reflects a marginal cooling in buyer activity compared to last month, though year-over-year growth indicates a more robust market recovery. Economic factors such as mortgage rates and inventory constraints continue to shape market dynamics.
Demand for entry-level single-family homes remains unchanged, reflecting constrained inventory and affordability challenges. Luxury condos maintain the highest buyer interest but show slight cooling in demand compared to last month. Luxury single-family homes face slower demand amid limited inventory. Mid-market single-family homes experience a modest softening, while entry-level condos have shifted from steady to slow demand. Townhouses remain in slow demand. Overall, the market demonstrates mixed performance, shaped by evolving buyer preferences and economic conditions.
Monthly Statistics for December 2024
Home Demand
Index
Index
73
(Slow)
Home Demand Index
from prior month
from prior month
74
Home Demand Index
from prior year
from prior year
67
Index change
from prior month
from prior month
-1.4%
Index change from
same time last year
same time last year
9%
Bright MLS | T3 Home Demand Index
www.homedemandindex.com
Baltimore | November 2024
Home Demand Index
The Home Demand Index (HDI) for Baltimore currently stands at 72, reflecting a notable decrease from last months 87 and an increase from last year’s 66. This decline indicates a cooling in buyer interest compared to the previous month, though the annual growth highlights a more resilient demand in the market. Market dynamics continue to be influenced by economic factors, including fluctuations in mortgage rates and inventory constraints.
Demand for entry-level single-family homes is rising, with affordable options attracting more buyers. Luxury condos maintain the highest buyer interest, showing a slight gain in demand. Mid-market single-family homes have softened, while entry-level condos are holding steady. Townhouses see slower demand, constrained by limited inventory. The overall market shows mixed performance across home types, adapting to evolving buyer preferences.
Monthly Statistics for November 2024
Home Demand
Index
Index
72
(Slow)
Home Demand Index
from prior month
from prior month
87
Home Demand Index
from prior year
from prior year
66
Index change
from prior month
from prior month
-17.2%
Index change from
same time last year
same time last year
9.1%
Bright MLS | T3 Home Demand Index
www.homedemandindex.com
Baltimore | October 2024
Home Demand Index
The Home Demand Index (HDI) for Baltimore in this report period stands at 84, slightly down from 86 last month but considerably higher than the 54 recorded one year ago. This indicates a softening in buyer demand compared to the previous month, despite the continued year-over-year improvement. Market conditions continue to be shaped by economic uncertainties, including mortgage rate fluctuations and inventory constraints.
Demand for entry-level single-family homes in Baltimore rose by 4%, driven by increased buyer interest in affordable housing. Luxury condos experienced a modest 1% gain, maintaining the highest buyer interest across all segments. Mid-market single-family homes saw a slight downturn, while entry-level condos held steady in demand. Townhouses experienced a slow pace of demand, reflecting tighter inventory. Overall, the market is adapting to buyer preferences, with mixed performance across home types.
Monthly Statistics for October 2024
Home Demand
Index
Index
84
(Slow)
Home Demand Index
from prior month
from prior month
86
Home Demand Index
from prior year
from prior year
54
Index change
from prior month
from prior month
-2.3%
Index change from
same time last year
same time last year
55.6%
Bright MLS | T3 Home Demand Index
www.homedemandindex.com
Baltimore | September 2024
Home Demand Index
The Home Demand Index (HDI) for Baltimore this report period stands at 84, indicating a decrease from last month’s 89 and consistent with a similar level last year of 86. This decline suggests a continuation of the market softening, with cautious buyer engagement amidst prevailing economic uncertainties. Market conditions remain influenced by fluctuating economic factors, including mortgage rates and inventory levels.
During this report period in Baltimore, entry-level single-family homes saw declining demand, categorized as Limited, with constrained inventory levels. Mid-market single-family homes exhibited modest improvement, moving towards Steady demand, while luxury single-family homes experienced a slight decrease but continued to maintain Moderate buyer interest. Demand for entry-level condos remained steady, supported by low inventory levels. Luxury condos continue to attract strong interest, despite a 15% decrease in the index. Townhouses showed increased demand, indicating steady buyer activity amid tight inventory conditions.
Monthly Statistics for September 2024
Home Demand
Index
Index
84
(Slow)
Home Demand Index
from prior month
from prior month
89
Home Demand Index
from prior year
from prior year
86
Index change
from prior month
from prior month
-5.6%
Index change from
same time last year
same time last year
-2.3%
Bright MLS | T3 Home Demand Index
www.homedemandindex.com
All reports for the Baltimore Market Area.
List of available data files. Note that the data file includes all data for the report period across the entire Bright MLS footprint.