August 2024 Report
Baltimore Metro
Baltimore | August 2024
Home Demand Index
The Home Demand Index (HDI) for Baltimore this report period stands at 86, reflecting a modest improvement from last month’s 80 but slightly below the previous year’s 88. This suggests a stable yet cautious market environment, with buyer interest remaining relatively steady. The increase from last month indicates some recovery, though the slight year-over-year decline highlights ongoing economic uncertainties.
In August 2024, the Baltimore housing market exhibited strong buyer interest across all home types, particularly in the high-priced segments. Demand for luxury single-family homes, entry-level condos, and townhouses increased compared to the previous month, while interest in luxury condos remained robust. Despite a 24% increase in inventory levels, supply remains relatively low, with months of supply ranging from 1.3 months for mid-market single-family homes to 3.7 months for luxury condos. This low inventory continues to fuel competitive market conditions, leaving buyers with limited options, especially in the mid-market and luxury segments. This is likely driving sustained price growth, particularly in the luxury market.

Monthly Statistics for August 2024
Home Demand
Index
Index
86
(Slow)
Home Demand Index
from prior month
from prior month
80
Home Demand Index
from prior year
from prior year
88
Index change
from prior month
from prior month
7.5%
Index change from
same time last year
same time last year
-2.3%
Bright MLS | T3 Home Demand Index
www.homedemandindex.com
Baltimore | August 2024
Home Demand Index | Historical Year-over-Year Comparison
From July 2023 to June 2024, the Home Demand Index (HDI) shows a steady overall decline in buyer interest, reflecting ongoing challenges in the market. The Index fell below last year’s level, indicating softer demand, particularly in the latter half of the period. Contributing factors include higher mortgage rates and limited inventory, which have significantly impacted buyer activity and market dynamics throughout the year.
Home Demand Index
Bright MLS | T3 Home Demand Index
www.homedemandindex.com
Baltimore | August 2024
Home Demand Map
In the Baltimore Metro area, Howard County saw the strongest demand for homes, with Moderate buyer interest indicating consistent market activity. Baltimore, Anne Arundel, and Harford counties also experienced a shift from Slow to Steady buyer interest, reflecting a general uptick in market conditions. Although Baltimore city and Carroll county experienced the weakest activity last month, falling into the “Limited to Slow” category, they still showed some progress from previous periods. Coastal regions like DelMar Coastal are experiencing Moderate conditions, indicating a stable and active market, while the Maryland Eastern Shore, categorized as Steady, suggests a balanced market with consistent buyer interest. The overall increase in buyer interest across these regions can be attributed to factors such as increased inventory and a continuing decline in mortgage rates. Coastal and Eastern Shore markets benefit from seasonal appeal and less competitive conditions compared to urban areas, contributing to their stable or moderate market conditions.
Bright MLS | T3 Home Demand Index
www.homedemandindex.com
Baltimore | August 2024
Demand and Inventory by Home Type
In August 2024, the Baltimore housing market exhibited strong buyer interest across all home types, particularly in the high-priced segments. Demand for luxury single-family homes, entry-level condos, and townhouses increased compared to the previous month, while interest in luxury condos remained robust. Despite a 24% increase in inventory levels, supply remains relatively low, with months of supply ranging from 1.3 months for mid-market single-family homes to 3.7 months for luxury condos. This low inventory continues to fuel competitive market conditions, leaving buyers with limited options, especially in the mid-market and luxury segments. This is likely driving sustained price growth, particularly in the luxury market.
Bright MLS | T3 Home Demand Index
www.homedemandindex.com
Baltimore | August 2024
Single Family Home Below $350k
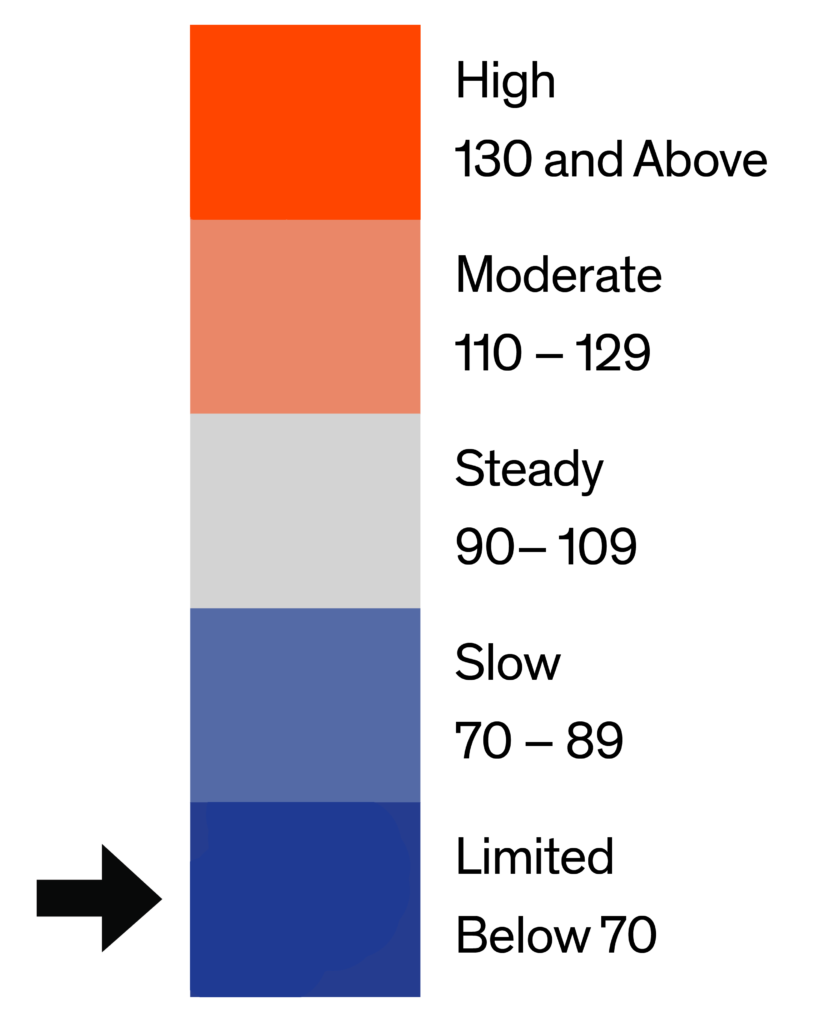
“In August 2024, the index for entry-level single-family homes priced below $350K stands at 69, marking an 8% increase from last month’s 64 and a 5% increase from 66 a year ago. The upward trends suggest a market recovery following recent declines. The months of supply slightly increased from 1.4 months to 1.5 months compared to the previous month. The slight decline in mortgage rates and the increase in inventory levels are creating a more favorable market for buyers.
“

Monthly Statistics for Single Family Home Below $350k
Home Demand
Index
Index
69
(Limited)
Home Demand Index
from prior month
from prior month
64
Home Demand Index
from prior year
from prior year
66
Months of
inventory
inventory
1.5
Average daily inventory last month
443
Inventory sold
last month
last month
295
Bright MLS | T3 Home Demand Index
www.homedemandindex.com
Baltimore | August 2024
Single Family Home $350k - $801k
In the mid-market segment of single-family homes priced between $350K and $801K, demand saw a slight increase, with an HDI of 85. This reflects a 5% increase from the previous month’s HDI of 81 but a 3% decline from the previous year’s HDI of 88. Sales in this segment increased by 2.77% compared to the previous month, while the months supply rose by 1.3 months. Despite the increase in HDI, buyer interest remains at a slow pace.

Monthly Statistics for Single Family Home $350k - $801k
Home Demand
Index
Index
85
(Slow)
Home Demand Index
from prior month
from prior month
81
Home Demand Index
from prior year
from prior year
88
Months of
Inventory
Inventory
1.3
Average daily inventory last month
1,196
Inventory sold
last month
last month
891
Bright MLS | T3 Home Demand Index
www.homedemandindex.com
Baltimore | August 2024
Single Family Home Above $801k
The index for luxury single-family homes priced above $801K stands at 100 this month, up by 10% from 91 last month but 12% lower compared to 114 last year. Demand has shifted to a steady pace during this period, improving from the slow pace of previous months. Inventory levels remain a factor, with a 2.2 month supply, highlighting the ongoing competitive conditions for luxury home buyers.

Monthly Statistics for Single Family Home Above $801k
Home Demand
Index
Index
100
(Steady)
Home Demand Index
from prior month
from prior month
91
Home Demand Index
from prior year
from prior year
114
Months of
Inventory
Inventory
2.2
Average daily inventory last month
533
Inventory sold
last month
last month
241
Bright MLS | T3 Home Demand Index
www.homedemandindex.com
Baltimore | August 2024
Condo Below $391k
The index for entry-level condos priced below $391K is 102 this month, marking a significant increase from 87 last month and a 9% up from 94 a year ago. This surge in the index indicates a robust recovery in the entry-level condo market, reflecting heightened demand and increased buyer activity. This limited availability is fueling a competitive environment for first-time condo buyers, as fewer properties are on the market to satisfy the rising demand.

Monthly Statistics for Condo Below $391k
Home Demand
Index
Index
102
(Steady)
Home Demand Index
from prior month
from prior month
87
Home Demand Index
from prior year
from prior year
94
Months of
Inventory
Inventory
1.8
Average daily inventory last month
324
Inventory sold
last month
last month
181
Bright MLS | T3 Home Demand Index
www.homedemandindex.com
Baltimore | August 2024
Condo Above $391k
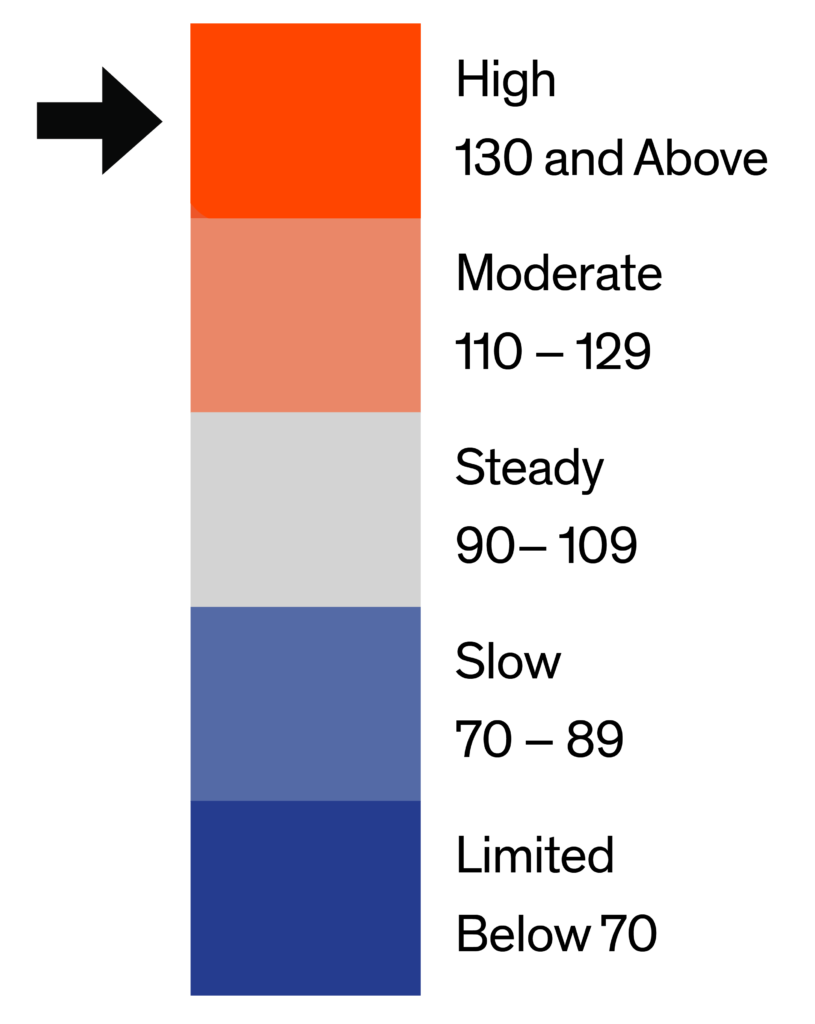
The index for luxury condos priced above $391K is 152 this month, up 13% from 134 last month and 9% from 140 a year ago. This indicates high demand in the luxury segment, maintaining robust buyer interest. Despite the increase in inventory, the months supply of homes remains relatively low, contributing to competitive market conditions for luxury condo buyers.

Monthly Statistics for Condo Above $391k
Home Demand
Index
Index
152
(High)
Home Demand Index
from prior month
from prior month
134
Home Demand Index
from prior year
from prior year
140
Months of
Inventory
Inventory
3.7
Average daily inventory last month
110
Inventory sold
last month
last month
30
Bright MLS | T3 Home Demand Index
www.homedemandindex.com
Baltimore | August 2024
Townhouse/Rowhouse/Twin All prices
Townhouse/
Rowhouse/Twin
All prices
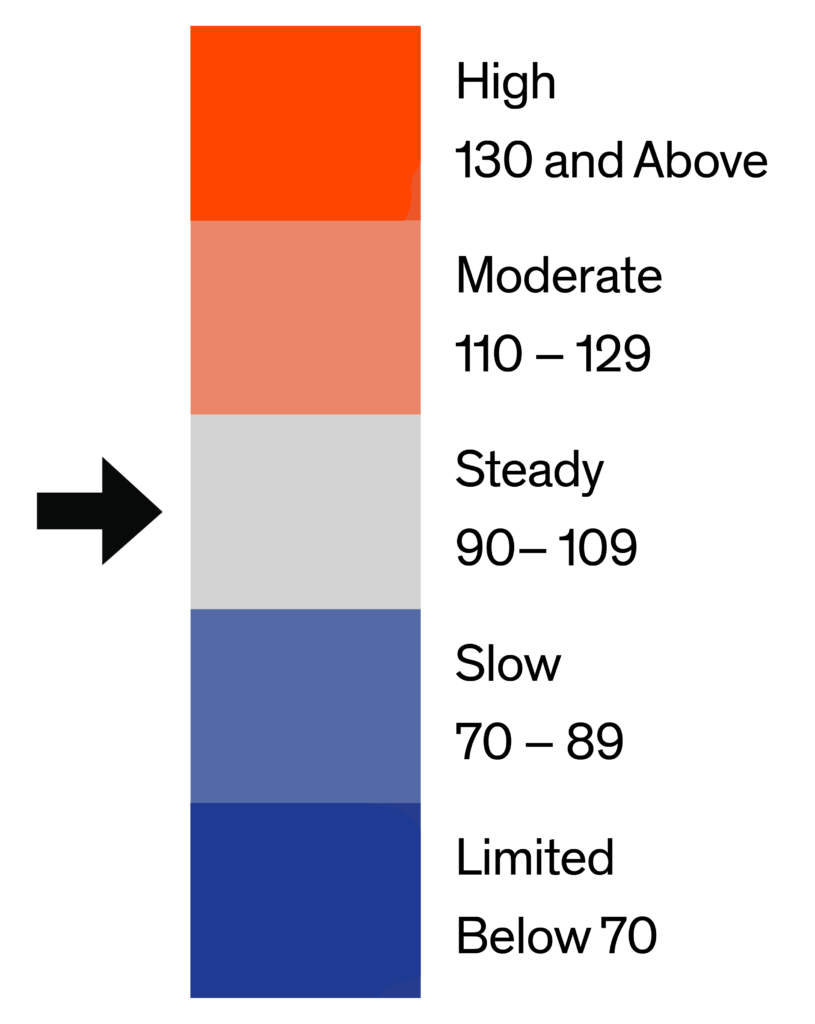
The index for townhouses, rowhouses, and twins currently stands at 90, reflecting demand in the Steady category, 10% up from 82 last month and 94 last year. Sales have slightly increased by 4% compared to the previous month. Additionally, the months supply has increased to 2.3 months, up from 2 months in the previous month. The increase in months supply suggests that while more properties are becoming available, inventory is still relatively low.

Monthly Statistics for Townhouse/Rowhouse/TwinAll prices
Home Demand
Index
Index
90
(Steady)
Home Demand Index
from prior month
from prior month
82
Home Demand Index
from prior year
from prior year
94
Months of
Inventory
Inventory
2.3
Average daily inventory last month
2,449
Inventory sold
last month
last month
1,043
Bright MLS | T3 Home Demand Index
www.homedemandindex.com
Note
1. This report is generated with data from the following counties:
- Baltimore Metro – Anne Arundel, MD; Baltimore City, MD; Baltimore, MD; Carroll, MD; Harford, MD; Howard, MD;
- DelMar Coastal – Somerset, MD; Sussex, DE; Wicomico, MD; Worcester, MD;
- Maryland Eastern Shore – Caroline, MD; Cecil, MD; Dorchester, MD; Kent, MD; Queen Annes, MD; Talbot, MD;
2. This report is for the August 2024 period with data collected from the previous month.
Released: August 11, 2024
Reference ID: 2091
Baltimore | August 2024
Home Demand Map (Zip Codes)
In the Baltimore Metro area, Howard County saw the strongest demand for homes, with Moderate buyer interest indicating consistent market activity. Baltimore, Anne Arundel, and Harford counties also experienced a shift from Slow to Steady buyer interest, reflecting a general uptick in market conditions. Although Baltimore city and Carroll county experienced the weakest activity last month, falling into the “Limited to Slow” category, they still showed some progress from previous periods. Coastal regions like DelMar Coastal are experiencing Moderate conditions, indicating a stable and active market, while the Maryland Eastern Shore, categorized as Steady, suggests a balanced market with consistent buyer interest. The overall increase in buyer interest across these regions can be attributed to factors such as increased inventory and a continuing decline in mortgage rates. Coastal and Eastern Shore markets benefit from seasonal appeal and less competitive conditions compared to urban areas, contributing to their stable or moderate market conditions.

Bright MLS | T3 Home Demand Index
www.homedemandindex.com