February 2023 Report
Baltimore Metro
Baltimore | February 2023
Home Demand Index
Demand for homes in the Baltimore Metro area rose in January according to the Bright MLS | T3 Home Demand Index. The Index, at 77, rose 22.2 percent over the month reflecting a Slow pace of buyer activity but was 17.2 percent lower than one year earlier.
Demand for each type of home rose in January with the greatest increase in luxury condos priced over $375,000 followed by demand for luxury single-family homes over $750,000. In addition to increasing the most over the month, demand for luxury condos was also the strongest with the Index reflecting Steady demand. Demand was Limited for entry-level single-family homes under $330,000 and in the Slow range for all other types of homes. The months supply ranged from 1.8 months for entry-level condos to 3.7 months for luxury condos.

Monthly Statistics for February 2023
Home Demand
Index
Index
77
(Slow)
Home Demand Index
from prior month
from prior month
63
Home Demand Index
from prior year
from prior year
93
Index change
from prior month
from prior month
22.2%
Index change from
same time last year
same time last year
-17.2%
Bright MLS | T3 Home Demand Index
www.homedemandindex.com
Baltimore | February 2023
Home Demand Index | Historical Year-over-Year Comparison
Demand for homes rose in January following a five-month decline in buyer activity. The softening of demand was due, in part, to higher mortgage rates and economic uncertainty tied to elevated inflation and concerns about the potential for a recession. The January increase in the Index, even with significant headwinds, reflects the anticipated seasonal uptick in activity as would-be buyers begin searching for homes ahead of the spring market.
Home Demand Index
Bright MLS | T3 Home Demand Index
www.homedemandindex.com
Baltimore | February 2023
Home Demand Map
In the Baltimore Metro area, demand for homes was Steady in Baltimore County and Limited in Baltimore City. Buyer interest was in the Slow category in the other metro area counties in January. Demand was Slow in the DelMar Coastal and Maryland Eastern Shore areas. Across the Greater Baltimore Area, buyer interest in 20 percent of ZIP codes was in the High or Moderate range, twice as many as in December. Roughly four-in-ten ZIP codes exhibited Limited demand, down from two-thirds of communities in December.
Bright MLS | T3 Home Demand Index
www.homedemandindex.com
Baltimore | February 2023
Demand and Inventory by Home Type
Demand for each type of home rose in January with the greatest increase in luxury condos priced over $375,000 followed by demand for luxury single-family homes over $750,000. In addition to increasing the most over the month, demand for luxury condos was also the strongest with the Index reflecting Steady demand. Demand was Limited for entry-level single-family homes under $330,000 and in the Slow range for all other types of homes. The months supply ranged from 1.8 months for entry-level condos to 3.7 months for luxury condos.
Bright MLS | T3 Home Demand Index
www.homedemandindex.com
Baltimore | February 2023
Single Family Home Below $330k
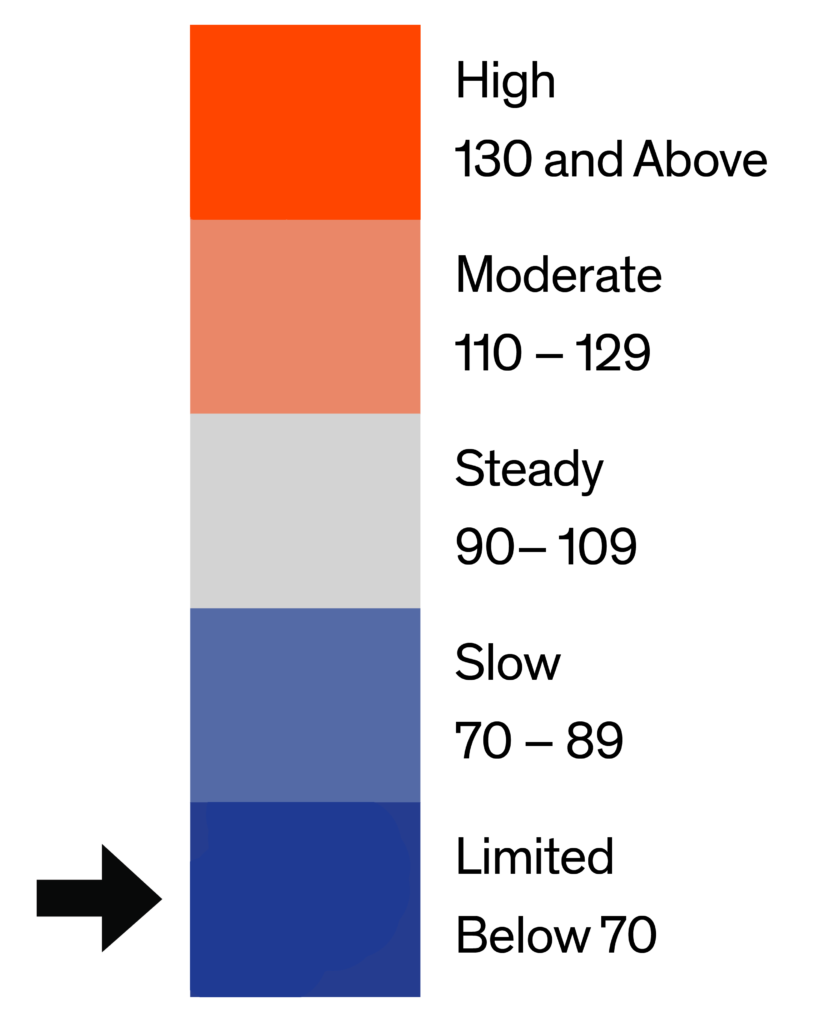
Buyer interest in entry-level single-family homes rose slightly but remained in the Limited category of demand. In the Baltimore Metro market, entry-level single-family home demand was weaker than any other segment in January. There was a 2.1 months supply of homes for sale.

Monthly Statistics for Single Family Home Below $330k
Home Demand
Index
Index
69
(Limited)
Home Demand Index
from prior month
from prior month
61
Home Demand Index
from prior year
from prior year
82
Months of
inventory
inventory
2.1
Average daily inventory last month
447
Inventory sold
last month
last month
212
Bright MLS | T3 Home Demand Index
www.homedemandindex.com
Baltimore | February 2023
Single Family Home $330k - $750k
The Bright MLS | T3 Home Demand Index for mid-market single-family homes rose 22 percent in January to 71 reflecting a Slow pace of demand. Compared with one year earlier, the Index was 18 percent lower. There was a 2.1 months supply of homes on the market.

Monthly Statistics for Single Family Home $330k - $750k
Home Demand
Index
Index
71
(Slow)
Home Demand Index
from prior month
from prior month
58
Home Demand Index
from prior year
from prior year
87
Months of
Inventory
Inventory
2.1
Average daily inventory last month
891
Inventory sold
last month
last month
427
Bright MLS | T3 Home Demand Index
www.homedemandindex.com
Baltimore | February 2023
Single Family Home Above $750k
Buyer interest in luxury single-family homes priced over $750,000 rose in January. The Index, at 71, was up by nearly one-third over the month and virtually the same as one year earlier. Demand was, however, in the Slow range even with the increase. There was a 3.5 months supply, higher than the other lower-priced single-family segments.

Monthly Statistics for Single Family Home Above $750k
Home Demand
Index
Index
71
(Slow)
Home Demand Index
from prior month
from prior month
54
Home Demand Index
from prior year
from prior year
73
Months of
Inventory
Inventory
3.5
Average daily inventory last month
318
Inventory sold
last month
last month
92
Bright MLS | T3 Home Demand Index
www.homedemandindex.com
Baltimore | February 2023
Condo Below $375k
Demand for entry-level condos, on the market for less than $375,000, increased in January. The Bright MLS | T3 Home Demand Index rose by roughly one-fourth to 82, reflecting a Slow pace of activity. Buyer interest was lower than one year earlier as well when demand was in the Steady range. The inventory of homes for sale was notably lean, with a months supply of just 1.8, lower than any other segment of the Baltimore Metro market.

Monthly Statistics for Condo Below $375k
Home Demand
Index
Index
82
(Slow)
Home Demand Index
from prior month
from prior month
65
Home Demand Index
from prior year
from prior year
105
Months of
Inventory
Inventory
1.8
Average daily inventory last month
203
Inventory sold
last month
last month
110
Bright MLS | T3 Home Demand Index
www.homedemandindex.com
Baltimore | February 2023
Condo Above $375k
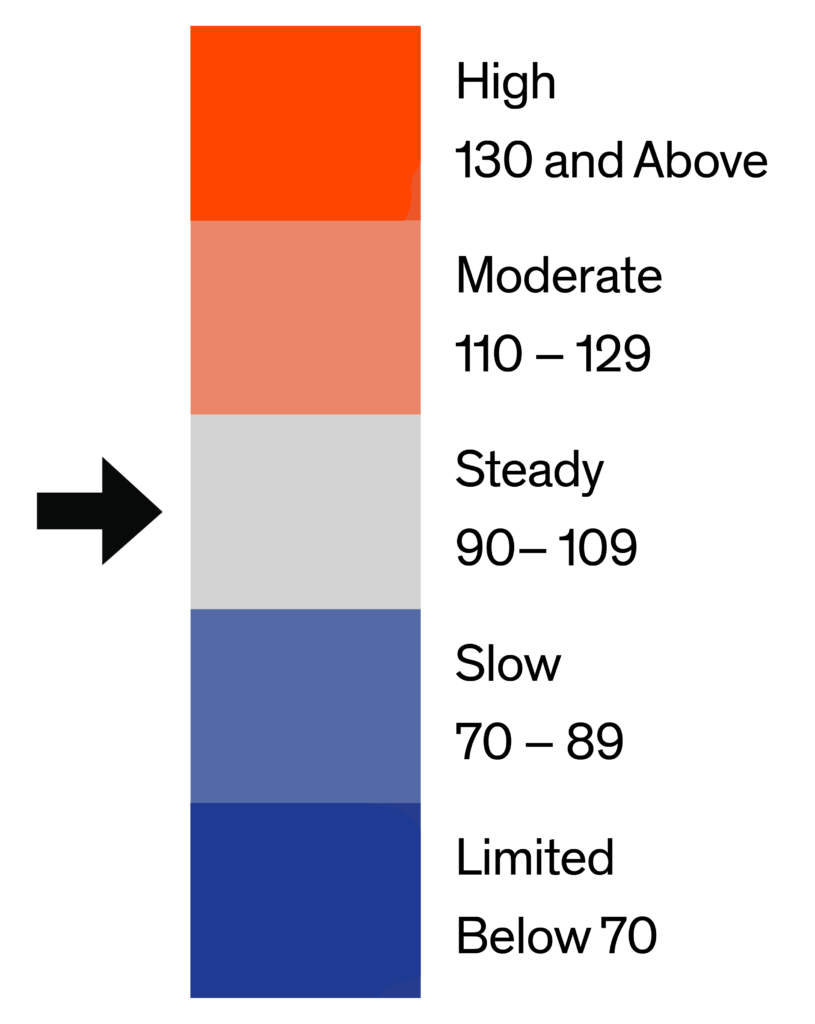
The Index for luxury condos rose by one-third to 101 in January, a level of demand in the Steady range. Despite the increase, the Index was 45 percent lower than one year earlier when buyer interest was very strong. The months supply was at 3.7 months, higher than any other segment of the market.

Monthly Statistics for Condo Above $375k
Home Demand
Index
Index
101
(Steady)
Home Demand Index
from prior month
from prior month
75
Home Demand Index
from prior year
from prior year
183
Months of
Inventory
Inventory
3.7
Average daily inventory last month
71
Inventory sold
last month
last month
19
Bright MLS | T3 Home Demand Index
www.homedemandindex.com
Baltimore | February 2023
Townhouse/Rowhouse/Twin All prices
Townhouse/
Rowhouse/Twin
All prices
Townhouse demand increased over the month along with the rest of the metro market. The Index rose to 87 but remained in the Slow demand category. The months supply rose to three months from 2.4 months in December as both the number of listings and sales declined in January.

Monthly Statistics for Townhouse/Rowhouse/TwinAll prices
Home Demand
Index
Index
87
(Slow)
Home Demand Index
from prior month
from prior month
72
Home Demand Index
from prior year
from prior year
108
Months of
Inventory
Inventory
3
Average daily inventory last month
1,989
Inventory sold
last month
last month
664
Bright MLS | T3 Home Demand Index
www.homedemandindex.com
Note
1. This report is generated with data from the following counties:
- Baltimore Metro – Anne Arundel, MD; Baltimore City, MD; Baltimore, MD; Carroll, MD; Harford, MD; Howard, MD;
- DelMar Coastal – Somerset, MD; Sussex, DE; Wicomico, MD; Worcester, MD;
- Maryland Eastern Shore – Caroline, MD; Cecil, MD; Dorchester, MD; Kent, MD; Queen Annes, MD; Talbot, MD;
2. This report is for the February 2023 period with data collected from the previous month.
Released: February 3, 2023
Reference ID: 1768
Baltimore | February 2023
Home Demand Map (Zip Codes)
In the Baltimore Metro area, demand for homes was Steady in Baltimore County and Limited in Baltimore City. Buyer interest was in the Slow category in the other metro area counties in January. Demand was Slow in the DelMar Coastal and Maryland Eastern Shore areas. Across the Greater Baltimore Area, buyer interest in 20 percent of ZIP codes was in the High or Moderate range, twice as many as in December. Roughly four-in-ten ZIP codes exhibited Limited demand, down from two-thirds of communities in December.

Bright MLS | T3 Home Demand Index
www.homedemandindex.com