November 2024 Report
Baltimore Metro
Baltimore | November 2024
Home Demand Index
The Home Demand Index (HDI) for Baltimore currently stands at 72, reflecting a notable decrease from last months 87 and an increase from last year’s 66. This decline indicates a cooling in buyer interest compared to the previous month, though the annual growth highlights a more resilient demand in the market. Market dynamics continue to be influenced by economic factors, including fluctuations in mortgage rates and inventory constraints.
Demand for entry-level single-family homes is rising, with affordable options attracting more buyers. Luxury condos maintain the highest buyer interest, showing a slight gain in demand. Mid-market single-family homes have softened, while entry-level condos are holding steady. Townhouses see slower demand, constrained by limited inventory. The overall market shows mixed performance across home types, adapting to evolving buyer preferences.

Monthly Statistics for November 2024
Home Demand
Index
Index
72
(Slow)
Home Demand Index
from prior month
from prior month
87
Home Demand Index
from prior year
from prior year
66
Index change
from prior month
from prior month
-17.2%
Index change from
same time last year
same time last year
9.1%
Bright MLS | T3 Home Demand Index
www.homedemandindex.com
Baltimore | November 2024
Home Demand Index | Historical Year-over-Year Comparison
The year-over-year comparison for Baltimore’s HDI reflects a steady increase, with the index rising from 66 a year ago to 72 currently. This growth indicates a moderately strengthening market despite monthly fluctuations. The trend suggests buyers’ confidence is gradually improving, even as economic uncertainties remain.
Home Demand Index
Bright MLS | T3 Home Demand Index
www.homedemandindex.com
Baltimore | November 2024
Home Demand Map
In the Baltimore Metro area, despite buyer interest shifting from steady to slow in Howard, Harford, and Baltimore Counties, it remains the strongest among the regions. Baltimore City experiences limited demand, marking the lowest buyer interest across the metro region. Coastal regions such as DelMar Coastal continue to see moderate to steady demand, benefitting from seasonal appeal, while the Maryland Eastern Shore is shifting from a steady to a slow pace.
Bright MLS | T3 Home Demand Index
www.homedemandindex.com
Baltimore | November 2024
Demand and Inventory by Home Type
Demand for entry-level single-family homes is rising, with affordable options attracting more buyers. Luxury condos maintain the highest buyer interest, showing a slight gain in demand. Mid-market single-family homes have softened, while entry-level condos are holding steady. Townhouses see slower demand, constrained by limited inventory. The overall market shows mixed performance across home types, adapting to evolving buyer preferences.
Bright MLS | T3 Home Demand Index
www.homedemandindex.com
Baltimore | November 2024
Single Family Home Below $355k
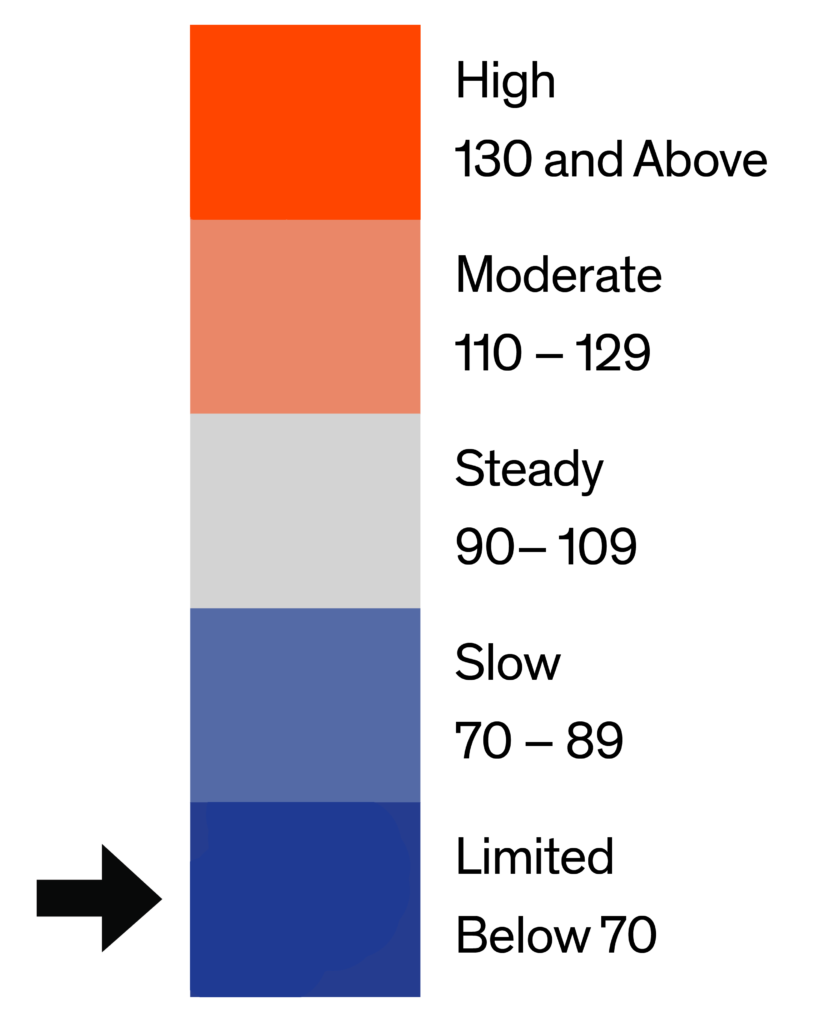
The index for single-family homes priced below $355K is at 62, down from 78 last month and higher than last year’s 57. This decline reflects a decrease in interest in entry-level homes, as inventory remains low at just 1.6 months. The current market for affordable housing faces challenges due to this limited inventory, impacting availability for potential buyers.

Monthly Statistics for Single Family Home Below $355k
Home Demand
Index
Index
62
(Limited)
Home Demand Index
from prior month
from prior month
78
Home Demand Index
from prior year
from prior year
57
Months of
inventory
inventory
1.6
Average daily inventory last month
484
Inventory sold
last month
last month
299
Bright MLS | T3 Home Demand Index
www.homedemandindex.com
Baltimore | November 2024
Single Family Home $355k - $814k
The mid-range index for single-family homes is 72, a decline from 87 last month but a notable increase from last year’s 64. This shift points to softening buyer interest month-over-month, though demand remains healthier than a year ago. Tight inventory levels maintain a competitive environment in this segment.

Monthly Statistics for Single Family Home $355k - $814k
Home Demand
Index
Index
72
(Slow)
Home Demand Index
from prior month
from prior month
87
Home Demand Index
from prior year
from prior year
64
Months of
Inventory
Inventory
1.6
Average daily inventory last month
1,132
Inventory sold
last month
last month
720
Bright MLS | T3 Home Demand Index
www.homedemandindex.com
Baltimore | November 2024
Single Family Home Above $814k
The luxury single-family index stands at 71, a significant drop from 90 last month but an increase over last year’s 68, signaling a cooling in high-end buyer demand. This decline suggests cautious engagement among luxury buyers. Limited inventory continues to drive competitive conditions in this market.

Monthly Statistics for Single Family Home Above $814k
Home Demand
Index
Index
71
(Slow)
Home Demand Index
from prior month
from prior month
90
Home Demand Index
from prior year
from prior year
68
Months of
Inventory
Inventory
2.1
Average daily inventory last month
416
Inventory sold
last month
last month
198
Bright MLS | T3 Home Demand Index
www.homedemandindex.com
Baltimore | November 2024
Condo Below $400k
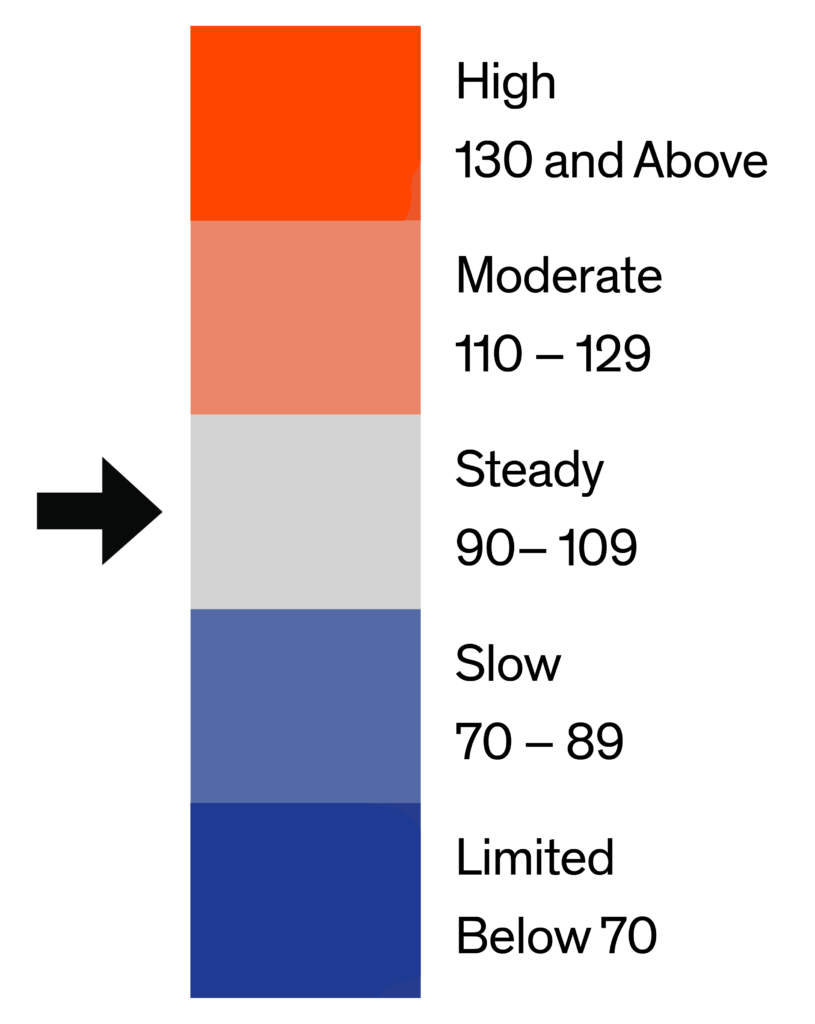
The entry-level condo index is 91, a decrease from 102 last month but higher than last year’s index of 86. This reflects steady buyer interest despite a slight cooling trend. Demand in this segment remains competitive, driven by affordability.

Monthly Statistics for Condo Below $400k
Home Demand
Index
Index
91
(Steady)
Home Demand Index
from prior month
from prior month
102
Home Demand Index
from prior year
from prior year
86
Months of
Inventory
Inventory
2.1
Average daily inventory last month
313
Inventory sold
last month
last month
149
Bright MLS | T3 Home Demand Index
www.homedemandindex.com
Baltimore | November 2024
Condo Above $400k
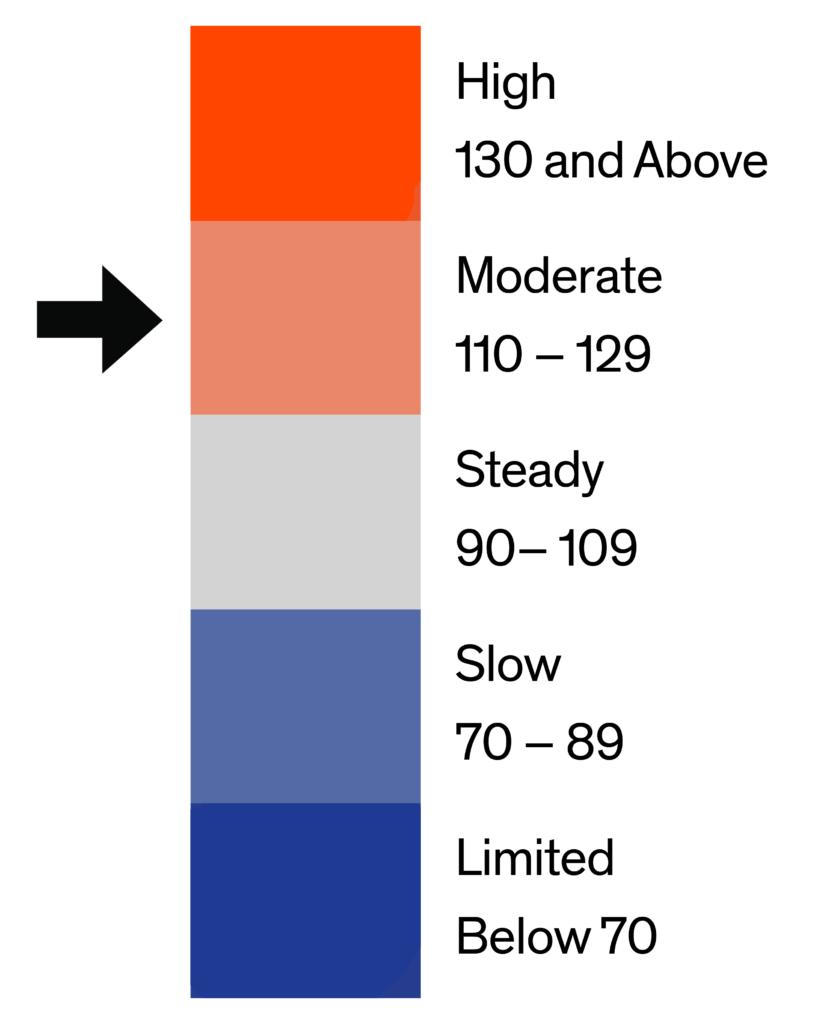
The luxury condo index has decreased to 122, down from last month’s 145 but notably higher than last year’s 95, indicating steady buyer interest amid softening month-over-month. The moderate inventory increase helps sustain the robust interest from high-end buyers. This competitive environment reflects consistent demand despite slight market adjustments.

Monthly Statistics for Condo Above $400k
Home Demand
Index
Index
122
(Moderate)
Home Demand Index
from prior month
from prior month
145
Home Demand Index
from prior year
from prior year
95
Months of
Inventory
Inventory
2.8
Average daily inventory last month
92
Inventory sold
last month
last month
33
Bright MLS | T3 Home Demand Index
www.homedemandindex.com
Baltimore | November 2024
Townhouse/Rowhouse/Twin All prices
Townhouse/
Rowhouse/Twin
All prices
The index for townhouses and similar properties stands at 75, down from 90 last month but above last year’s 70, indicating sustained but cooling buyer interest. The month-over-month decrease suggests a shift towards a slower demand pace. Inventory levels remain constrained, maintaining competition among buyers in this segment.

Monthly Statistics for Townhouse/Rowhouse/TwinAll prices
Home Demand
Index
Index
75
(Slow)
Home Demand Index
from prior month
from prior month
90
Home Demand Index
from prior year
from prior year
70
Months of
Inventory
Inventory
2.3
Average daily inventory last month
2,230
Inventory sold
last month
last month
984
Bright MLS | T3 Home Demand Index
www.homedemandindex.com
Note
1. This report is generated with data from the following counties:
- Baltimore Metro – Anne Arundel, MD; Baltimore City, MD; Baltimore, MD; Carroll, MD; Harford, MD; Howard, MD;
- DelMar Coastal – Somerset, MD; Sussex, DE; Wicomico, MD; Worcester, MD;
- Maryland Eastern Shore – Caroline, MD; Cecil, MD; Dorchester, MD; Kent, MD; Queen Annes, MD; Talbot, MD;
2. This report is for the November 2024 period with data collected from the previous month.
Released: November 11, 2024
Reference ID: 2140
Baltimore | November 2024
Home Demand Map (Zip Codes)
In the Baltimore Metro area, despite buyer interest shifting from steady to slow in Howard, Harford, and Baltimore Counties, it remains the strongest among the regions. Baltimore City experiences limited demand, marking the lowest buyer interest across the metro region. Coastal regions such as DelMar Coastal continue to see moderate to steady demand, benefitting from seasonal appeal, while the Maryland Eastern Shore is shifting from a steady to a slow pace.

Bright MLS | T3 Home Demand Index
www.homedemandindex.com