October 2024 Report
Baltimore Metro
Baltimore | October 2024
Home Demand Index
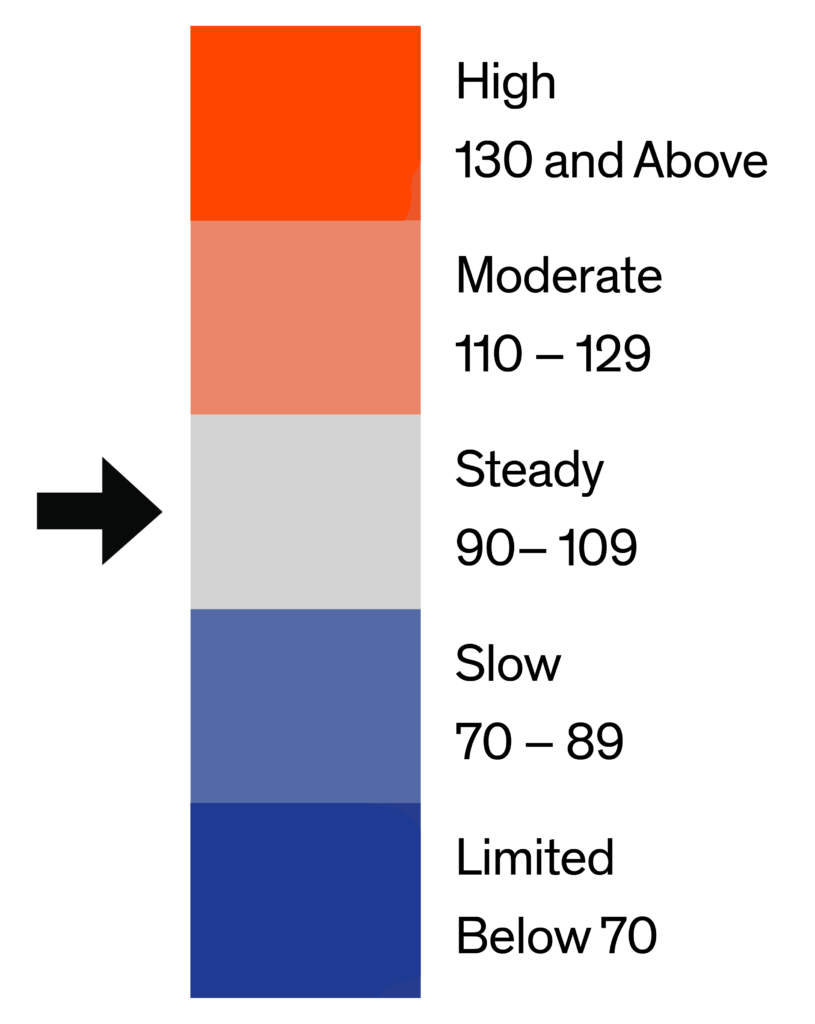
The Home Demand Index (HDI) for Baltimore in this report period stands at 84, slightly down from 86 last month but considerably higher than the 54 recorded one year ago. This indicates a softening in buyer demand compared to the previous month, despite the continued year-over-year improvement. Market conditions continue to be shaped by economic uncertainties, including mortgage rate fluctuations and inventory constraints.
Demand for entry-level single-family homes in Baltimore rose by 4%, driven by increased buyer interest in affordable housing. Luxury condos experienced a modest 1% gain, maintaining the highest buyer interest across all segments. Mid-market single-family homes saw a slight downturn, while entry-level condos held steady in demand. Townhouses experienced a slow pace of demand, reflecting tighter inventory. Overall, the market is adapting to buyer preferences, with mixed performance across home types.

Monthly Statistics for October 2024
Home Demand
Index
Index
84
(Slow)
Home Demand Index
from prior month
from prior month
86
Home Demand Index
from prior year
from prior year
54
Index change
from prior month
from prior month
-2.3%
Index change from
same time last year
same time last year
55.6%
Bright MLS | T3 Home Demand Index
www.homedemandindex.com
Baltimore | October 2024
Home Demand Index | Historical Year-over-Year Comparison
Over the past 12 months, the Home Demand Index (HDI) for Baltimore rose from 54 last year to 84 this year, reflecting a significant 55% increase in buyer interest. This upward trend highlights a recovering market, despite some recent monthly fluctuations. The higher year-over-year demand signals a more resilient housing market, though economic pressures like affordability continue to influence overall activity.
Home Demand Index
Bright MLS | T3 Home Demand Index
www.homedemandindex.com
Baltimore | October 2024
Home Demand Map
In the Baltimore Metro area, Howard, Harford, and Baltimore Counties exhibited strong demand for homes, characterized by steady buyer interest. In contrast, Baltimore City experienced the weakest activity, categorized as limited demand. The remaining counties fall into the slow demand category. Coastal regions like DelMar Coastal and Maryland Eastern Shore maintained moderate and steady demand, reflecting healthier market conditions compared to urban areas.
Bright MLS | T3 Home Demand Index
www.homedemandindex.com
Baltimore | October 2024
Demand and Inventory by Home Type
Demand for entry-level single-family homes in Baltimore rose by 4%, driven by increased buyer interest in affordable housing. Luxury condos experienced a modest 1% gain, maintaining the highest buyer interest across all segments. Mid-market single-family homes saw a slight downturn, while entry-level condos held steady in demand. Townhouses experienced a slow pace of demand, reflecting tighter inventory. Overall, the market is adapting to buyer preferences, with mixed performance across home types.
Bright MLS | T3 Home Demand Index
www.homedemandindex.com
Baltimore | October 2024
Single Family Home Below $352k
The index for single-family homes priced below $352K stands at 74, up from 71 last month and significantly higher than last year’s index of 45. This reflects increasing buyer interest in this price segment, likely fueled by improved affordability and inventory. The steady month-to-month rise suggests a recovering market for entry-level homes, although inventory constraints remain a challenge.

Monthly Statistics for Single Family Home Below $352k
Home Demand
Index
Index
74
(Slow)
Home Demand Index
from prior month
from prior month
71
Home Demand Index
from prior year
from prior year
45
Months of
inventory
inventory
2.2
Average daily inventory last month
530
Inventory sold
last month
last month
237
Bright MLS | T3 Home Demand Index
www.homedemandindex.com
Baltimore | October 2024
Single Family Home $352k - $805k
The index for mid-range single-family homes between $352K and $805K is 84, reflecting a slight decline from last month’s 86 but a notable increase from 54 last year. This indicates buyer interest remains relatively steady, though recent fluctuations may point to cautious behavior in light of economic uncertainties. The year-over-year growth highlights a stronger market recovery, though buyers are more selective in this price range.

Monthly Statistics for Single Family Home $352k - $805k
Home Demand
Index
Index
84
(Slow)
Home Demand Index
from prior month
from prior month
86
Home Demand Index
from prior year
from prior year
54
Months of
Inventory
Inventory
1.8
Average daily inventory last month
1,271
Inventory sold
last month
last month
695
Bright MLS | T3 Home Demand Index
www.homedemandindex.com
Baltimore | October 2024
Single Family Home Above $805k
The index for luxury single-family homes priced above $805K is 89 this month, slightly down from last month’s 91 but significantly higher than last year’s index of 62. This suggests a cooling in luxury buyer activity compared to the previous month, potentially due to seasonal factors or economic caution. However, the year-over-year increase underscores a strong recovery in the luxury market, reflecting growing buyer confidence in higher-priced homes.

Monthly Statistics for Single Family Home Above $805k
Home Demand
Index
Index
89
(Slow)
Home Demand Index
from prior month
from prior month
91
Home Demand Index
from prior year
from prior year
62
Months of
Inventory
Inventory
2.9
Average daily inventory last month
503
Inventory sold
last month
last month
176
Bright MLS | T3 Home Demand Index
www.homedemandindex.com
Baltimore | October 2024
Condo Below $400k
The index for entry-level condos priced below $400K stands at 96 this month, down from last month’s 102 but significantly higher than last year’s index of 59. This slight month-over-month decline suggests cooling buyer interest, but the strong year-over-year growth indicates sustained demand in this affordable price segment. Inventory constraints may be limiting buyer options, contributing to the competitive market.

Monthly Statistics for Condo Below $400k
Home Demand
Index
Index
96
(Steady)
Home Demand Index
from prior month
from prior month
102
Home Demand Index
from prior year
from prior year
59
Months of
Inventory
Inventory
2.4
Average daily inventory last month
347
Inventory sold
last month
last month
142
Bright MLS | T3 Home Demand Index
www.homedemandindex.com
Baltimore | October 2024
Condo Above $400k
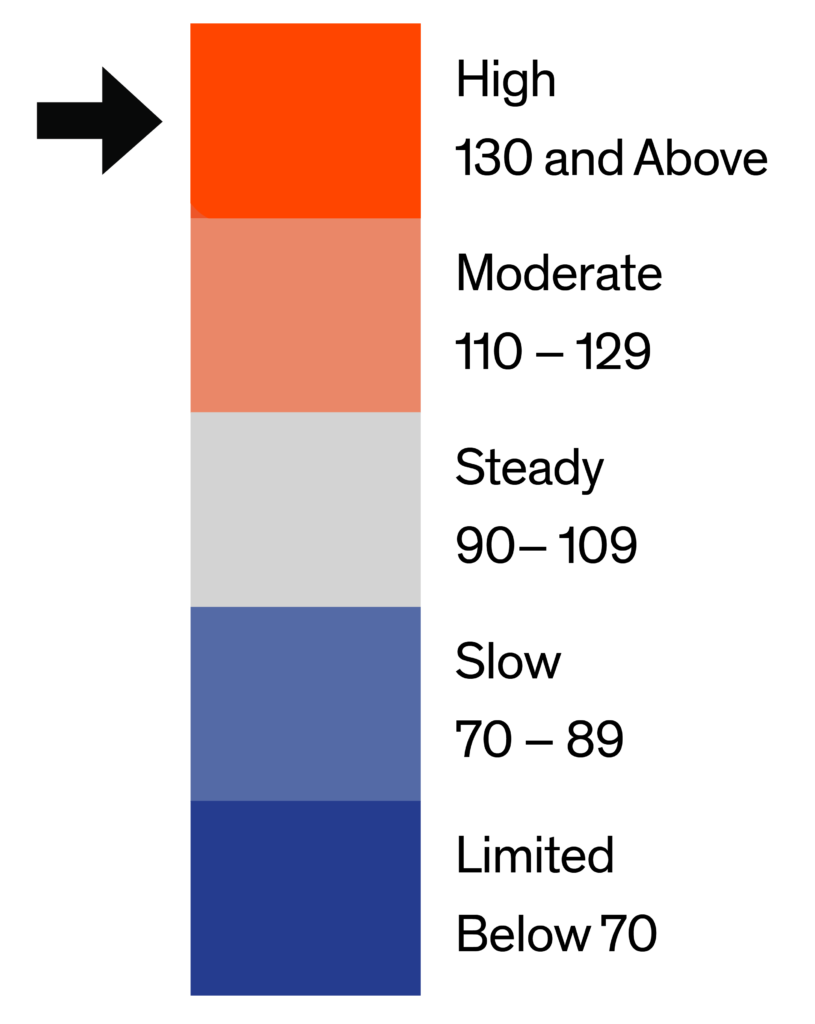
The index for luxury condos priced above $400K is 142, up from last month’s 140 and 43% higher than last year’s index of 99. This continued growth signals robust demand for high-end condos, with buyers showing increased interest in this market segment. The rise in inventory levels may be providing more options for buyers, maintaining a competitive environment in the luxury condo market.

Monthly Statistics for Condo Above $400k
Home Demand
Index
Index
142
(High)
Home Demand Index
from prior month
from prior month
140
Home Demand Index
from prior year
from prior year
99
Months of
Inventory
Inventory
4.3
Average daily inventory last month
112
Inventory sold
last month
last month
26
Bright MLS | T3 Home Demand Index
www.homedemandindex.com
Baltimore | October 2024
Townhouse/Rowhouse/Twin All prices
Townhouse/
Rowhouse/Twin
All prices
The index for townhouses, rowhouses, and twins stands at 88, reflecting a slight decline from last month’s 91 but a significant increase from last year’s index of 57. Buyer interest in this segment remains slow, possibly due to limited inventory and less attractive options. The low months of supply continues to contribute to competitive market conditions, though demand has softened recently.

Monthly Statistics for Townhouse/Rowhouse/TwinAll prices
Home Demand
Index
Index
88
(Slow)
Home Demand Index
from prior month
from prior month
91
Home Demand Index
from prior year
from prior year
57
Months of
Inventory
Inventory
2.9
Average daily inventory last month
2,533
Inventory sold
last month
last month
888
Bright MLS | T3 Home Demand Index
www.homedemandindex.com
Note
1. This report is generated with data from the following counties:
- Baltimore Metro – Anne Arundel, MD; Baltimore City, MD; Baltimore, MD; Carroll, MD; Harford, MD; Howard, MD;
- DelMar Coastal – Somerset, MD; Sussex, DE; Wicomico, MD; Worcester, MD;
- Maryland Eastern Shore – Caroline, MD; Cecil, MD; Dorchester, MD; Kent, MD; Queen Annes, MD; Talbot, MD;
2. This report is for the October 2024 period with data collected from the previous month.
Released: October 11, 2024
Reference ID: 2125
Baltimore | October 2024
Home Demand Map (Zip Codes)
In the Baltimore Metro area, Howard, Harford, and Baltimore Counties exhibited strong demand for homes, characterized by steady buyer interest. In contrast, Baltimore City experienced the weakest activity, categorized as limited demand. The remaining counties fall into the slow demand category. Coastal regions like DelMar Coastal and Maryland Eastern Shore maintained moderate and steady demand, reflecting healthier market conditions compared to urban areas.

Bright MLS | T3 Home Demand Index
www.homedemandindex.com