September 2021 Report
Baltimore Metro
Baltimore | September 2021
Home Demand Index
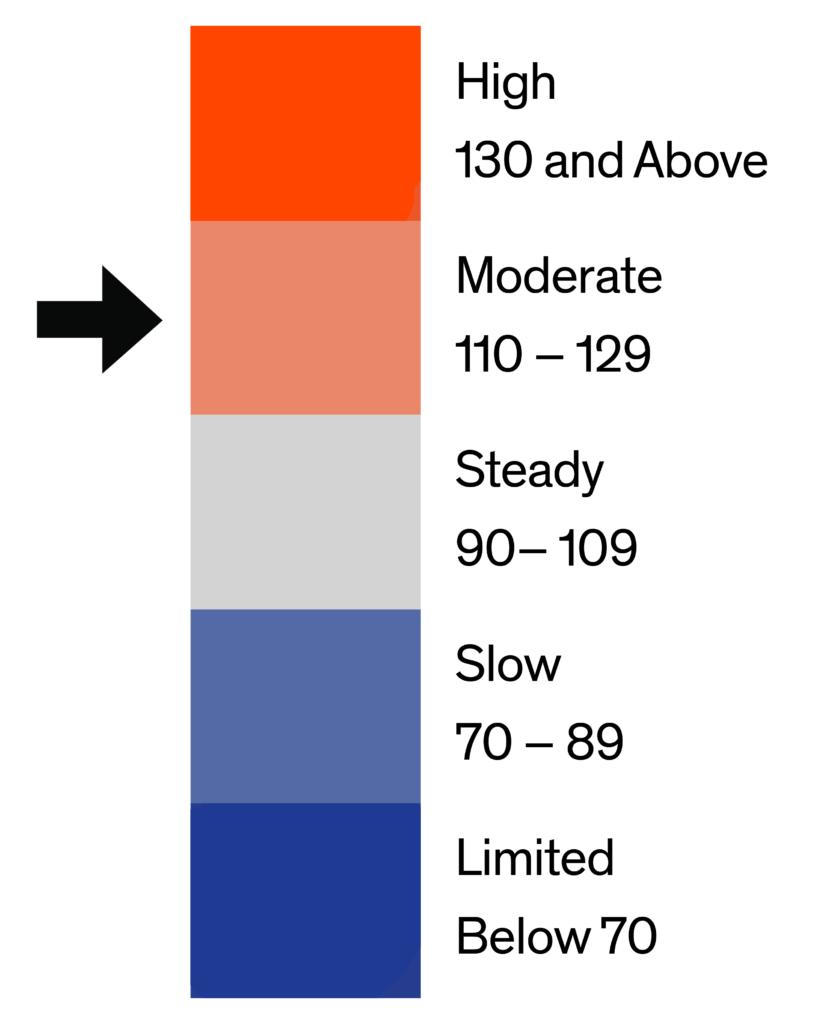
The Bright MLS | T3 Home Demand Index for the Baltimore Metro market area rose slightly in August to a reading of 129, reflecting a Moderate level of buyer demand. The Index was just over six percent below the level one year earlier.
In August, demand for higher-priced single-family homes and higher-priced condos was significantly stronger than any other type of home in the Baltimore Metro area. Overall, buyer demand for each type of home was little changed from the previous month. The month’s supply of inventory rose marginally for five of the six types of homes tracked by the Index. In contrast to other segments, the month’s supply in the relatively small higher-priced condo segment fell in August. The supply was lowest for mid-priced single-family homes at 1.1 months and greatest for higher-priced condos at 2.4 months.

Monthly Statistics for September 2021
Home Demand
Index
Index
129
(Moderate)
Home Demand Index
from prior month
from prior month
124
Home Demand Index
from prior year
from prior year
138
Index change
from prior month
from prior month
4%
Index change from
same time last year
same time last year
-6.5%
Bright MLS | T3 Home Demand Index
www.homedemandindex.com
Baltimore | September 2021
Home Demand Index | Historical Year-over-Year Comparison
Buyer interest in Baltimore Metro area homes eased from a High level of demand during the spring to a Moderate level of demand at mid-year. Most of the decline occurred in July following the rush by springtime homebuyers looking to take advantage of low mortgage interest rates and easing pandemic restrictions that made the home shopping experience easier.
Home Demand Index
Bright MLS | T3 Home Demand Index
www.homedemandindex.com
Baltimore | September 2021
Home Demand Map
Four of the six counties in the Baltimore Metro area recorded a High level of buyer demand in July. Baltimore City had the softest demand with an Index in the Steady category. Demand was in the High category in the Maryland Eastern Shore region and Moderate in the DelMar Coastal area. Across the Greater Baltimore area, 45 percent of ZIP codes recorded a High level of demand in August with an additional 17 percent showing a Moderate level of buyer interest. One-quarter of ZIP codes were in the Slow or Limited category.
Bright MLS | T3 Home Demand Index
www.homedemandindex.com
Baltimore | September 2021
Demand and Inventory by Home Type
In August, demand for higher-priced single-family homes and higher-priced condos was significantly stronger than any other type of home in the Baltimore Metro area. Overall, buyer demand for each type of home was little changed from the previous month. The month’s supply of inventory rose marginally for five of the six types of homes tracked by the Index. In contrast to other segments, the month’s supply in the relatively small higher-priced condo segment fell in August. The supply was lowest for mid-priced single-family homes at 1.1 months and greatest for higher-priced condos at 2.4 months.
Bright MLS | T3 Home Demand Index
www.homedemandindex.com
Baltimore | September 2021
Single Family Home Below $250k
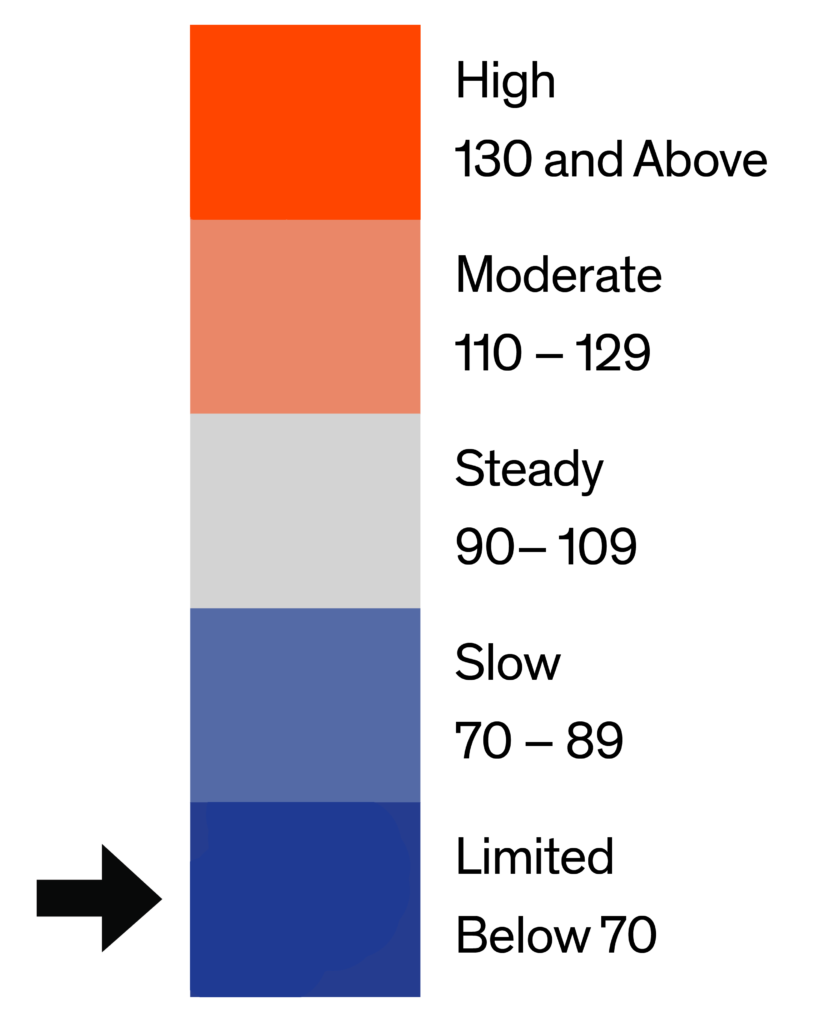
Demand for lower-priced single-family homes was virtually unchanged in August with an Index reading remaining in the Limited range. Buyer interest in this segment has been weak for several months. With an average daily inventory of just 328 in the entire Baltimore Metro area, the limited selection of homes offered relatively few options for would-be home buyers at this price point.

Monthly Statistics for Single Family Home Below $250k
Home Demand
Index
Index
56
(Limited)
Home Demand Index
from prior month
from prior month
55
Home Demand Index
from prior year
from prior year
86
Months of
inventory
inventory
1.4
Average daily inventory last month
328
Inventory sold
last month
last month
233
Bright MLS | T3 Home Demand Index
www.homedemandindex.com
Baltimore | September 2021
Single Family Home $250k - $590k
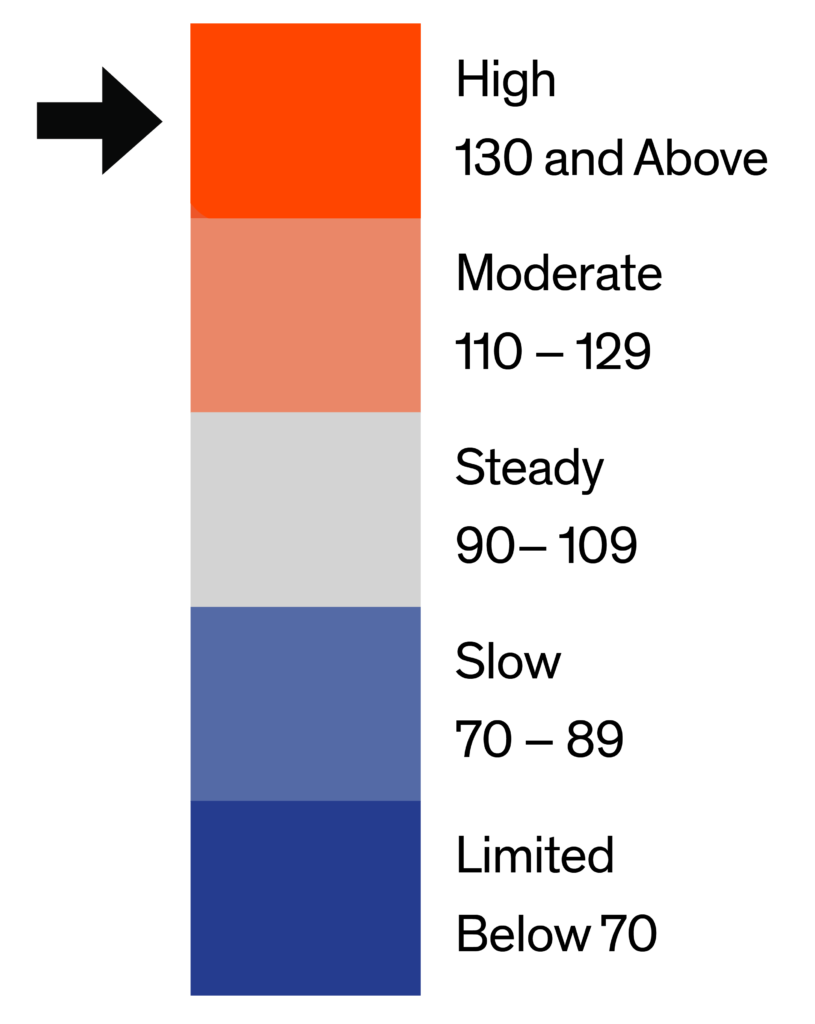
Buyer interest in mid-priced single-family homes rose marginally in August and remained at a High level according to the Bright MLS | T3 Home Demand Index. Demand also was virtually unchanged from the year before. The average daily inventory of homes rose over the month while sales decreased slightly. As a result, the monthly supply increased to 1.1 from a one-month supply in July, marking the second consecutive increase in months supply.

Monthly Statistics for Single Family Home $250k - $590k
Home Demand
Index
Index
135
(High)
Home Demand Index
from prior month
from prior month
132
Home Demand Index
from prior year
from prior year
134
Months of
Inventory
Inventory
1.1
Average daily inventory last month
1,470
Inventory sold
last month
last month
1,326
Bright MLS | T3 Home Demand Index
www.homedemandindex.com
Baltimore | September 2021
Single Family Home Above $590k
Demand for higher-priced single-family homes in the Baltimore Metro area remained at an elevated level in August even with a small decrease in the Index to a reading of 223. This segment has recorded strong levels of demand for several months. Limited inventory, at 1.6 months supply, remained a challenge for many buyers at this price point despite small increases during each of the past two months.

Monthly Statistics for Single Family Home Above $590k
Home Demand
Index
Index
223
(High)
Home Demand Index
from prior month
from prior month
226
Home Demand Index
from prior year
from prior year
214
Months of
Inventory
Inventory
1.6
Average daily inventory last month
851
Inventory sold
last month
last month
521
Bright MLS | T3 Home Demand Index
www.homedemandindex.com
Baltimore | September 2021
Condo Below $310k
The Bright MLS | T3 Home Demand Index for lower-priced condos was virtually unchanged in August and remained in the Moderate category with a reading of 114. Buyer interest in this segment has been consistently in the Moderate category for several months, even as the month’s supply has remained very low. In August, the inventory was equivalent to 1.2 months supply, unchanged from July.

Monthly Statistics for Condo Below $310k
Home Demand
Index
Index
114
(Moderate)
Home Demand Index
from prior month
from prior month
116
Home Demand Index
from prior year
from prior year
131
Months of
Inventory
Inventory
1.2
Average daily inventory last month
278
Inventory sold
last month
last month
238
Bright MLS | T3 Home Demand Index
www.homedemandindex.com
Baltimore | September 2021
Condo Above $310k
Buyer interest in higher-priced condos has been very strong for several months with an Index reading consistently in the High category. In August, demand increased to 230 from an already-elevated level of 227 in July. The strong demand also was reflected in a decline in the monthly supply to 2.4 in August from 2.9 in July.

Monthly Statistics for Condo Above $310k
Home Demand
Index
Index
230
(High)
Home Demand Index
from prior month
from prior month
227
Home Demand Index
from prior year
from prior year
202
Months of
Inventory
Inventory
2.4
Average daily inventory last month
177
Inventory sold
last month
last month
74
Bright MLS | T3 Home Demand Index
www.homedemandindex.com
Baltimore | September 2021
Townhouse/Rowhouse/Twin All prices
Townhouse/
Rowhouse/Twin
All prices
The Bright MLS | T3 Home Demand Index for townhouses rose eight percent in August, the largest month-to-month increase of any type of Baltimore Metro area home tracked by the Index. The inventory of townhouses for sale rose over the month as well, leading to a small rise in the monthly supply to 1.5.

Monthly Statistics for Townhouse/Rowhouse/TwinAll prices
Home Demand
Index
Index
141
(High)
Home Demand Index
from prior month
from prior month
131
Home Demand Index
from prior year
from prior year
149
Months of
Inventory
Inventory
1.5
Average daily inventory last month
2,584
Inventory sold
last month
last month
1,741
Bright MLS | T3 Home Demand Index
www.homedemandindex.com
Note
1. This report is generated with data from the following counties:
- Baltimore Metro – Anne Arundel, MD; Baltimore City, MD; Baltimore, MD; Carroll, MD; Harford, MD; Howard, MD;
- DelMar Coastal – Somerset, MD; Sussex, DE; Wicomico, MD; Worcester, MD;
- Maryland Eastern Shore – Caroline, MD; Cecil, MD; Dorchester, MD; Kent, MD; Queen Annes, MD; Talbot, MD;
2. This report is for the September 2021 period with data collected from the previous month.
Released: September 11, 2021
Reference ID: 1398
Baltimore | September 2021
Home Demand Map (Zip Codes)
Four of the six counties in the Baltimore Metro area recorded a High level of buyer demand in July. Baltimore City had the softest demand with an Index in the Steady category. Demand was in the High category in the Maryland Eastern Shore region and Moderate in the DelMar Coastal area. Across the Greater Baltimore area, 45 percent of ZIP codes recorded a High level of demand in August with an additional 17 percent showing a Moderate level of buyer interest. One-quarter of ZIP codes were in the Slow or Limited category.

Bright MLS | T3 Home Demand Index
www.homedemandindex.com