Philadelphia Metro
Metro Area Overview
Market Trend Map
Metro Area Overview
The Home Demand Index (HDI) for this report period stands at 71, reflecting an increase from last month’s 65 but a decline compared to last year’s 77. The month-over-month improvement indicates growing buyer activity, potentially driven by seasonal demand or improving economic conditions. However, the year-over-year decline suggests that demand remains softer than the previous year, highlighting ongoing market challenges.
The market trend line, below, provides a high-level monthly overview of the Home Demand Index for each of the metro market areas within the Greater Philadelphia Metro Area. The Home Demand Index is baselined at 100, with 90-110 indicating a steady market. Index values above 110 indicate moderate and high activity while Index values below 90 indicate slower or limited activity. For more information for a given period of time, click on any point on the map to pull up the monthly report.

Metro Market Trend Data by Bright MLS | T3 Home Demand Index
Each of the market areas listed above are defined as follows:
- Central Pennsylvania – Adams, PA; Berks, PA; Cumberland, PA; Dauphin, PA; Franklin, PA; Fulton, PA; Lancaster, PA; Lebanon, PA; Perry, PA; Schuylkill, PA; York, PA;
- Ocean County – Ocean, NJ;
- Philadelphia Metro – Bucks, PA; Burlington, NJ; Camden, NJ; Chester, PA; Delaware, PA; Gloucester, NJ; Kent, DE; Mercer, NJ; Montgomery, PA; New Castle, DE; Philadelphia, PA;
- Salem-Cumberland – Cumberland, NJ; Salem, NJ;
Market Trend Map
The Market Trend Map for the Philadelphia Metro pulls the county map from the monthly reports and combines to provide a time-lapse of the overall market. Use the navigation at the bottom to toggle between months.
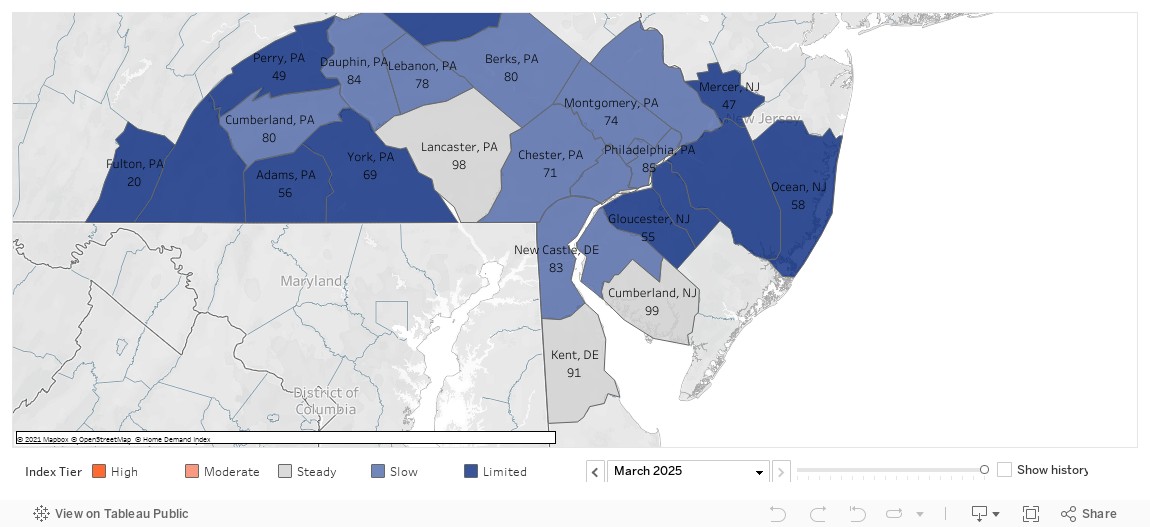
Philadelphia Metro County-Level Market Trend Map | Home Demand Index
Current Market Report
Last 6 Market Reports
Historical Market Reports
Data Download
Philadelphia | March 2025
Home Demand Index
The Home Demand Index (HDI) for this report period stands at 71, reflecting an increase from last month’s 65 but a decline compared to last year’s 77. The month-over-month improvement indicates growing buyer activity, potentially driven by seasonal demand or improving economic conditions. However, the year-over-year decline suggests that demand remains softer than the previous year, highlighting ongoing market challenges.
Demand for entry-level single-family homes remains stable at 71, down from 77 last year, reflecting ongoing affordability concerns. The luxury single-family segment saw a sharp increase to 51, rising from 41 last month, suggesting a surge in buyer interest or changes in inventory. This variation underscores the dynamic market conditions across different price tiers.

Monthly Statistics for March 2025
Home Demand
Index
Index
71
(Slow)
Home Demand Index
from prior month
from prior month
65
Home Demand Index
from prior year
from prior year
77
Index change
from prior month
from prior month
9.2%
Index change from
same time last year
same time last year
-7.8%
Bright MLS | T3 Home Demand Index
www.homedemandindex.com
Philadelphia | February 2025
Home Demand Index
The Home Demand Index (HDI) stands at 64, marking an increase from last month’s 49 but a slight decline compared to last year’s 66. This month-over-month rise suggests strengthening market conditions, potentially driven by seasonal factors or increased buyer activity. However, the year-over-year decline indicates that broader economic conditions or affordability constraints may still be influencing demand.
Entry-level single-family homes saw a moderate increase, rising from 54 last month to 63 this month. Mid-range single-family homes experienced a notable increase as well, rising to 55 from 41 last month. Luxury single-family homes also gained momentum, increasing from 28 to 40. Entry-level condos saw a substantial increase from 62 to 83, while luxury condos experienced the most significant growth, rising from 63 last month to 97. Townhouses also saw an increase. This divergence suggests shifting buyer priorities, with a stronger focus on the luxury segments across both single-family homes and condos.

Monthly Statistics for February 2025
Home Demand
Index
Index
64
(Limited)
Home Demand Index
from prior month
from prior month
49
Home Demand Index
from prior year
from prior year
66
Index change
from prior month
from prior month
30.6%
Index change from
same time last year
same time last year
-3%
Bright MLS | T3 Home Demand Index
www.homedemandindex.com
Philadelphia | January 2025
Home Demand Index
The Home Demand Index (HDI) for this report stands at 49, a decline from last month’s 69 and slightly lower than the 50 recorded during the same period last year. This decrease reflects continued cooling in market conditions, likely driven by economic pressures and seasonal factors. Despite the softer month-over-month trend, year-over-year demand remains relatively stable.
Demand for entry-level single-family homes decreased, with the index dropping from 73 last month to 53, remaining consistent with last year. Luxury condos also saw a decline, dropping from 86 last month to 63, but still showing an improvement compared to last year. Overall, demand has decreased from last month, reflecting a broader trend of reduced buyer interest across various segments, despite year-over-year improvement in the luxury condo market.
Monthly Statistics for January 2025
Home Demand
Index
Index
49
(Limited)
Home Demand Index
from prior month
from prior month
69
Home Demand Index
from prior year
from prior year
50
Index change
from prior month
from prior month
-29%
Index change from
same time last year
same time last year
-2%
Bright MLS | T3 Home Demand Index
www.homedemandindex.com
Philadelphia | December 2024
Home Demand Index
The Home Demand Index (HDI) currently stands at 69, down slightly from last month’s 70 but higher than last year’s index of 64. This trend reflects a marginal cooling in buyer activity month-over-month while maintaining a positive year-over-year trajectory. The steady annual improvement signals a recovering market with sustained buyer interest despite seasonal fluctuations.
Entry-level single-family homes have seen demand stabilize at 71, unchanged from last month but higher than last year’s 68. Mid-range homes experienced a slight decline, dropping from 64 last month to 62 this period. Luxury homes have seen a decrease, with demand falling from 56 last month to 47. The remaining home segments have shown an increase this period. This disparity suggests heightened competition in the luxury homes segment, while entry-level demand remains steady amid affordability constraints.
Monthly Statistics for December 2024
Home Demand
Index
Index
69
(Limited)
Home Demand Index
from prior month
from prior month
70
Home Demand Index
from prior year
from prior year
64
Index change
from prior month
from prior month
-1.4%
Index change from
same time last year
same time last year
7.8%
Bright MLS | T3 Home Demand Index
www.homedemandindex.com
Philadelphia | November 2024
Home Demand Index
The Home Demand Index (HDI) currently stands at 69, down from 82 in the previous month, yet reflecting an increase from last year’s index of 65. This trend indicates a moderate cooling in market activity month-over-month, while demand remains higher than last year’s level. The year-over-year improvement signals consistent recovery and steady buyer interest.
Inventory levels decreased from the previous month across all home types, and demand has also declined. The condo segment has shifted from steady to slow demand, while all types of single-family homes have moved from slow to limited demand. This suggests a transitioning market, where the decrease in inventory may influence buyer decision-making.
Monthly Statistics for November 2024
Home Demand
Index
Index
69
(Limited)
Home Demand Index
from prior month
from prior month
82
Home Demand Index
from prior year
from prior year
65
Index change
from prior month
from prior month
-15.9%
Index change from
same time last year
same time last year
6.2%
Bright MLS | T3 Home Demand Index
www.homedemandindex.com
Philadelphia | October 2024
Home Demand Index
The Home Demand Index (HDI) for this report period stands at 81, consistent with last month’s report and showing a notable increase from last year’s index of 50. This stability in demand signals steady buyer interest in the market, with housing activity holding firm. The year-over-year growth reflects stronger demand and a recovery from last year’s weaker market conditions.
In the current report period, inventory levels for all home segments in Philadelphia have slightly increased compared to the previous month, but sales have not shown the same upward trend. Despite the rise in available homes, demand for single-family home segments and townhouses remains slow. Luxury condos continue to experience steady market conditions, demonstrating stable buyer activity, while entry-level condos have shifted from a slow to a steady category, indicating improved interest. The overall rise in inventory suggests that more sellers are listing their homes, but stagnant sales imply that buyers may still be cautious, possibly due to economic uncertainties or affordability concerns.
Monthly Statistics for October 2024
Home Demand
Index
Index
81
(Slow)
Home Demand Index
from prior month
from prior month
81
Home Demand Index
from prior year
from prior year
50
Index change
from prior month
from prior month
0%
Index change from
same time last year
same time last year
62%
Bright MLS | T3 Home Demand Index
www.homedemandindex.com
Philadelphia | September 2024
Home Demand Index
The Home Demand Index (HDI) for this report period stands at 80, reflecting a slight decrease from last month’s 81 and a more noticeable decline from the previous year’s 85. This downward trend suggests a softening in market conditions, with buyer interest showing cautious engagement amid ongoing economic uncertainties. The year-over-year decline underscores continued adjustments in market dynamics influenced by broader economic factors.
For this report period, the demand for single-family homes shows varied performance across different segments. Entry-level single-family homes are experiencing a decrease in demand, with the index dropping to 73 from 75 last month, indicating continued affordability challenges. In contrast, mid-range single-family homes have a stable demand index of 77, while luxury homes reflect a more significant decline to 65, suggesting a softening of interest in the higher-end segment.
Monthly Statistics for September 2024
Home Demand
Index
Index
80
(Slow)
Home Demand Index
from prior month
from prior month
81
Home Demand Index
from prior year
from prior year
85
Index change
from prior month
from prior month
-1.2%
Index change from
same time last year
same time last year
-5.9%
Bright MLS | T3 Home Demand Index
www.homedemandindex.com
All reports for the Philadelphia Market Area.
List of available data files. Note that the data file includes all data for the report period across the entire Bright MLS footprint.