May 2024 Report
Philadelphia Metro
Philadelphia | May 2024
Home Demand Index
In May 2024, Philadelphia’s Home Demand Index (HDI) marks an 89, witnessing a recovery from April’s index of 85, yet down from 97 recorded in the previous year. This trend illustrates a moderate rebound in market demand, though it remains below the levels seen in the prior year, reflecting ongoing adjustments in buyer behavior and economic conditions across the Philadelphia Metro area.
Philadelphia’s housing market in May 2024 reflected strong buyer interest across various home types, especially in the higher-priced single-family home segment. The demand index for these properties showed a significant upswing, indicating a healthy appetite among buyers. The market conditions were characterized by low inventory, which has been a persistent challenge, driving a competitive market landscape. This ongoing demand surge, particularly for luxury homes, underscores the city’s robust real estate dynamics amidst tight supply conditions.

Monthly Statistics for May 2024
Home Demand
Index
Index
89
(Slow)
Home Demand Index
from prior month
from prior month
85
Home Demand Index
from prior year
from prior year
97
Index change
from prior month
from prior month
4.7%
Index change from
same time last year
same time last year
-8.2%
Bright MLS | T3 Home Demand Index
www.homedemandindex.com
Philadelphia | May 2024
Home Demand Index | Historical Year-over-Year Comparison
From May 2023 to April 2024, Philadelphia’s Home Demand Index (HDI) illustrates a a dip and substantial recovery in the housing market. Starting in the “Steady” range, the HDI dropped through late 2023 and from January 2024 had a resurgence indicating growing buyer activity. By April 2024, the index nearly returned to the Steady levels as seen in last year’s summer levels, showcasing a resilient market. As it stands, the market is hovering between Steady and Limited Index as we approach the Summer months.
Home Demand Index
Bright MLS | T3 Home Demand Index
www.homedemandindex.com
Philadelphia | May 2024
Home Demand Map
The Home Demand Index map for Philadelphia Metro in May 2024 illustrates diverse market dynamics across the region. The index shows Philadelphia Metro with an HDI of 89, categorized as “Slow,” indicating consistently weak buyer activity compared to the baseline. Nearby, Salem-Cumberland is more robust with an index of 119, classified as “Moderate,” suggesting consistently strong buyer interest. Contrastingly, Ocean County has an HDI of 53, falling into the “Limited” range, where there is very little demand and weak buyer activity.
Bright MLS | T3 Home Demand Index
www.homedemandindex.com
Philadelphia | May 2024
Demand and Inventory by Home Type
Philadelphia’s housing market in May 2024 reflected strong buyer interest across various home types, especially in the higher-priced single-family home segment. The demand index for these properties showed a significant upswing, indicating a healthy appetite among buyers. The market conditions were characterized by low inventory, which has been a persistent challenge, driving a competitive market landscape. This ongoing demand surge, particularly for luxury homes, underscores the city’s robust real estate dynamics amidst tight supply conditions.
Bright MLS | T3 Home Demand Index
www.homedemandindex.com
Philadelphia | May 2024
Single Family Home Below $325k
The index for single-family homes priced below $325k stands at 75, dropping from last month’s 80 and significantly below the previous year’s 97, marking a 23% decrease. This indicates a consistent Slow pace of buyer interest in this segment since February this year, possibly due to affordability challenges or lesser availability. The months supply, at 1.6 months, was decreased from 1.8 months in March.

Monthly Statistics for Single Family Home Below $325k
Home Demand
Index
Index
75
(Slow)
Home Demand Index
from prior month
from prior month
80
Home Demand Index
from prior year
from prior year
97
Months of
inventory
inventory
1.6
Average daily inventory last month
769
Inventory sold
last month
last month
481
Bright MLS | T3 Home Demand Index
www.homedemandindex.com
Philadelphia | May 2024
Single Family Home $325k - $725k
Homes priced between $325k and $725k show an index of 84, which is an 12% improvement over last month’s 75 but still 3% below the previous year’s 87. While the category falls into the Slow pace, this home segment shows signs of steady demand through out the year, potentially appealing to mid-market buyers. The months supply, at 1.4, was marginally lower than the previous month.

Monthly Statistics for Single Family Home $325k - $725k
Home Demand
Index
Index
84
(Slow)
Home Demand Index
from prior month
from prior month
75
Home Demand Index
from prior year
from prior year
87
Months of
Inventory
Inventory
1.4
Average daily inventory last month
2,093
Inventory sold
last month
last month
1,458
Bright MLS | T3 Home Demand Index
www.homedemandindex.com
Philadelphia | May 2024
Single Family Home Above $725k
For high-end homes above $725k, the index has risen 21% to 87 from last month’s 72, and it’s 1% higher than previous year’s 86. This segment is experiencing a tentative resurgence, likely driven by luxury buyers returning to the market. Buyer Interest in this segment remained at the of Slow level. The months supply decreased to 2.3 from 2.8 in March.

Monthly Statistics for Single Family Home Above $725k
Home Demand
Index
Index
87
(Slow)
Home Demand Index
from prior month
from prior month
72
Home Demand Index
from prior year
from prior year
86
Months of
Inventory
Inventory
2.3
Average daily inventory last month
884
Inventory sold
last month
last month
385
Bright MLS | T3 Home Demand Index
www.homedemandindex.com
Philadelphia | May 2024
Condo Below $390k
Condos priced below $390k exhibit strong demand with an index of 98, a 3% up from 95 last month and slightly higher than the previous year’s 96. This robust interest suggests that condos remain a popular choice, especially among first-time buyers and investors. The months supply of homes, at 2.7 months, was down from 2.8 months the previous month.

Monthly Statistics for Condo Below $390k
Home Demand
Index
Index
98
(Steady)
Home Demand Index
from prior month
from prior month
95
Home Demand Index
from prior year
from prior year
96
Months of
Inventory
Inventory
2.7
Average daily inventory last month
746
Inventory sold
last month
last month
276
Bright MLS | T3 Home Demand Index
www.homedemandindex.com
Philadelphia | May 2024
Condo Above $390k
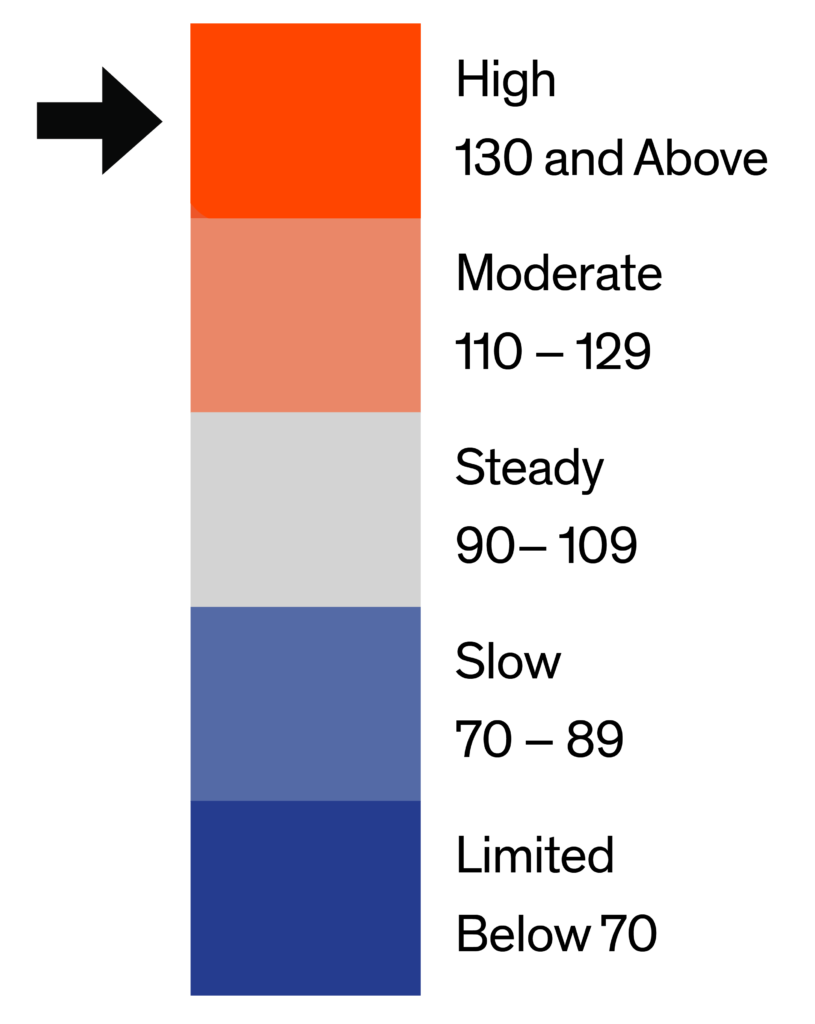
Higher-end condos priced above $390K see a remarkable demand with an index of 136, indicating a consistent high pace of buyer interest. This marks a slight increase from the prior month’s 135 but is down from 145 last year. This segment continues to attract significant buyer interest. There was a 5.3 months supply of homes available for sale, down from 6.1 months in March.

Monthly Statistics for Condo Above $390k
Home Demand
Index
Index
136
(High)
Home Demand Index
from prior month
from prior month
135
Home Demand Index
from prior year
from prior year
145
Months of
Inventory
Inventory
5.3
Average daily inventory last month
312
Inventory sold
last month
last month
59
Bright MLS | T3 Home Demand Index
www.homedemandindex.com
Philadelphia | May 2024
Townhouse/Rowhouse/Twin All prices
Townhouse/
Rowhouse/Twin
All prices
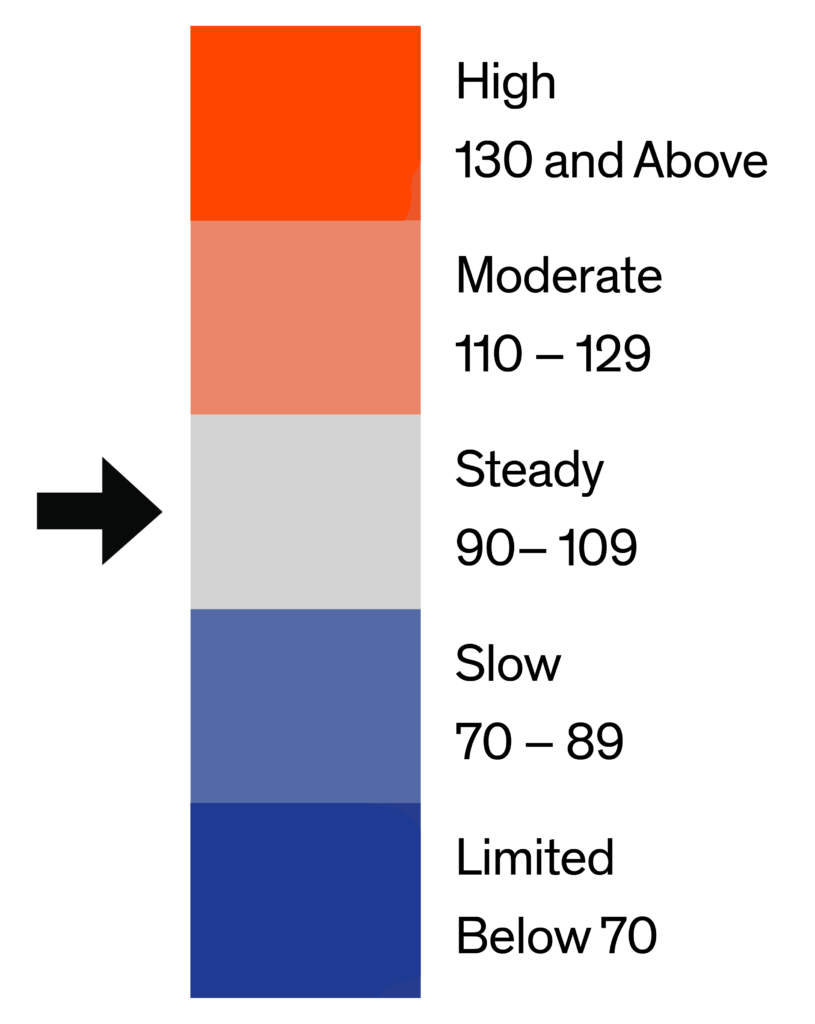
The index for townhouses, rowhouses, and twins is stable at 95, down slightly from 97 last month and significantly and compared with one year earlier, the Index was 12% lower. This housing type maintains steady popularity, reflecting ongoing demand in urban and suburban settings.The months supply, at 2.7 was lower at 2.9 months in March.

Monthly Statistics for Townhouse/Rowhouse/TwinAll prices
Home Demand
Index
Index
95
(Steady)
Home Demand Index
from prior month
from prior month
97
Home Demand Index
from prior year
from prior year
108
Months of
Inventory
Inventory
2.7
Average daily inventory last month
4,962
Inventory sold
last month
last month
1,872
Bright MLS | T3 Home Demand Index
www.homedemandindex.com
Note
1. This report is generated with data from the following counties:
- Central Pennsylvania – Adams, PA; Berks, PA; Cumberland, PA; Dauphin, PA; Franklin, PA; Fulton, PA; Lancaster, PA; Lebanon, PA; Perry, PA; Schuylkill, PA; York, PA;
- Ocean County – Ocean, NJ;
- Philadelphia Metro – Bucks, PA; Burlington, NJ; Camden, NJ; Chester, PA; Delaware, PA; Gloucester, NJ; Kent, DE; Mercer, NJ; Montgomery, PA; New Castle, DE; Philadelphia, PA;
- Salem-Cumberland – Cumberland, NJ; Salem, NJ;
2. This report is for the May 2024 period with data collected from the previous month.
Released: May 11, 2024
Reference ID: 2036
Philadelphia | May 2024
Home Demand Map (Zip Codes)
The Home Demand Index map for Philadelphia Metro in May 2024 illustrates diverse market dynamics across the region. The index shows Philadelphia Metro with an HDI of 89, categorized as “Slow,” indicating consistently weak buyer activity compared to the baseline. Nearby, Salem-Cumberland is more robust with an index of 119, classified as “Moderate,” suggesting consistently strong buyer interest. Contrastingly, Ocean County has an HDI of 53, falling into the “Limited” range, where there is very little demand and weak buyer activity.

Bright MLS | T3 Home Demand Index
www.homedemandindex.com