September 2022 Report
Philadelphia Metro
Philadelphia | September 2022
Home Demand Index
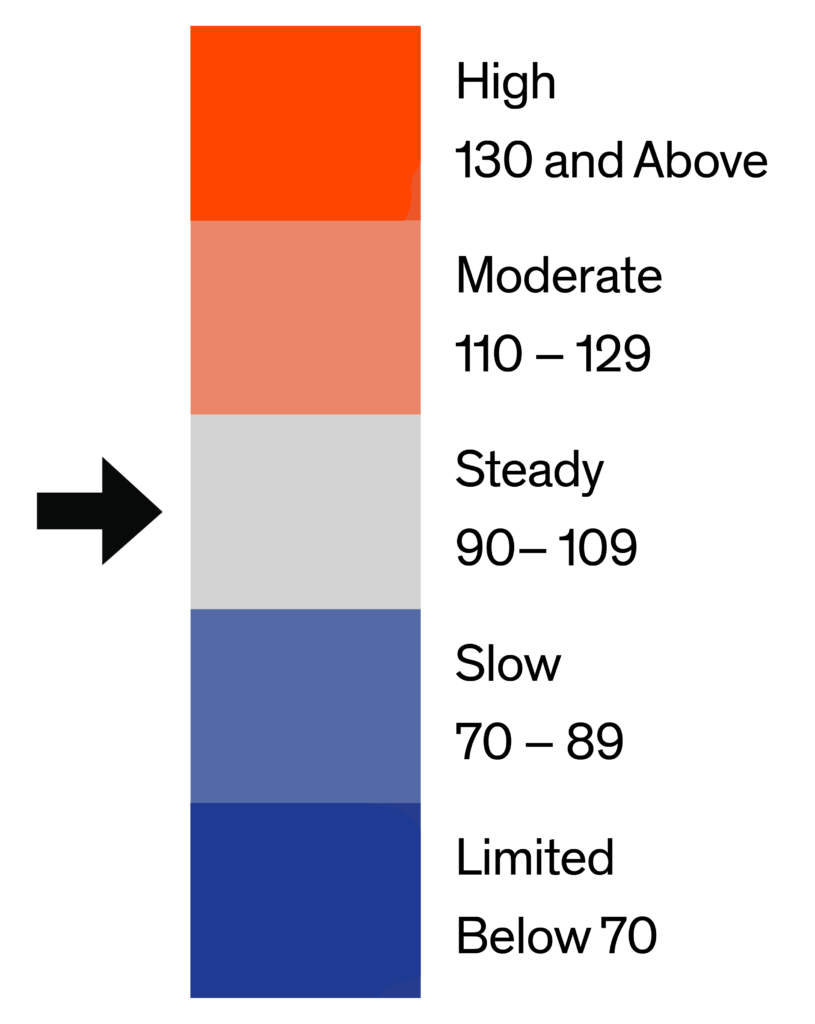
Demand for homes in the Philadelphia Metro market area fell in August according to the Bright MLS | T3 Home Demand Index. The Index, at 101, was 6.5 percent lower compared with the previous month and 14 percent lower than one year earlier.
Demand for Philadelphia Metro area homes was strongest for higher-priced single-family homes, which remained in the High demand category in August. Buyer interest was Steady for mid-priced single-family homes, lower-priced condos and townhouses. Demand rose marginally for higher-priced condos over the month and was down for each of the remaining types of homes. In August, the months supply fell for each type of home except higher-priced condos. The inventory of homes ranged from a 1.3 months supply for mid-priced single-family homes to a 5.5 months supply for higher-priced condos.

Monthly Statistics for September 2022
Home Demand
Index
Index
101
(Steady)
Home Demand Index
from prior month
from prior month
108
Home Demand Index
from prior year
from prior year
118
Index change
from prior month
from prior month
-6.5%
Index change from
same time last year
same time last year
-14.4%
Bright MLS | T3 Home Demand Index
www.homedemandindex.com
Philadelphia | September 2022
Home Demand Index | Historical Year-over-Year Comparison
During the spring and early summer months, demand for homes in the Philadelphia Metro area was in the Moderate range, well below the pace set one year earlier when the Index reflected a High level of buyer interest. Demand has decreased during the past two months for a cumulative decline of nearly 16 percent. The decrease reflects several headwinds for buyers including higher mortgage rates and elevated inflation, which has reduced the ability of some would-be buyers to purchase a home.
Home Demand Index
Bright MLS | T3 Home Demand Index
www.homedemandindex.com
Philadelphia | September 2022
Home Demand Map
In the Philadelphia Metro area, demand was strongest in Kent County, the only county in the High demand category in August. Buyer interest was Moderate or Steady across the rest of the Pennsylvania and Delaware counties in the metro area while demand was Slow in each of the suburban New Jersey counties. Buyer interest remained in the High range in the Salem-Cumberland market area and was at a Steady level in Central Pennsylvania. Across the Greater Philadelphia area demand was in the High category in 26 percent of ZIP codes compared with 31 percent in July. In 44 percent of ZIP codes, the Index was in the Slow or Limited range, an increase from 39 percent the previous month.
Bright MLS | T3 Home Demand Index
www.homedemandindex.com
Philadelphia | September 2022
Demand and Inventory by Home Type
Demand for Philadelphia Metro area homes was strongest for higher-priced single-family homes, which remained in the High demand category in August. Buyer interest was Steady for mid-priced single-family homes, lower-priced condos and townhouses. Demand rose marginally for higher-priced condos over the month and was down for each of the remaining types of homes. In August, the months supply fell for each type of home except higher-priced condos. The inventory of homes ranged from a 1.3 months supply for mid-priced single-family homes to a 5.5 months supply for higher-priced condos.
Bright MLS | T3 Home Demand Index
www.homedemandindex.com
Philadelphia | September 2022
Single Family Home Below $195k
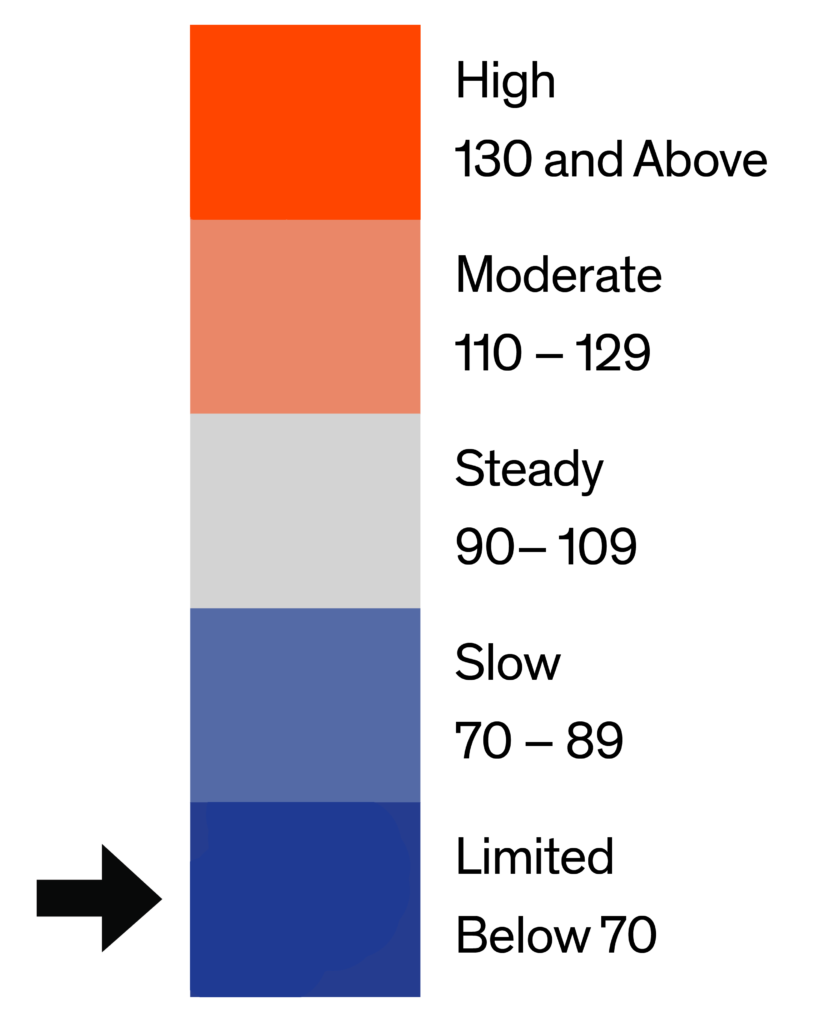
Buyer interest in lower-priced single-family homes was Limited in August, continuing a months-long trend of weak demand. The Index was down marginally to 23 and was nearly 50 percent below the level one year earlier. The months supply dropped to 1.9 from 2.5 months in July due largely to a small increase in sales over the month.

Monthly Statistics for Single Family Home Below $195k
Home Demand
Index
Index
23
(Limited)
Home Demand Index
from prior month
from prior month
26
Home Demand Index
from prior year
from prior year
43
Months of
inventory
inventory
1.9
Average daily inventory last month
349
Inventory sold
last month
last month
184
Bright MLS | T3 Home Demand Index
www.homedemandindex.com
Philadelphia | September 2022
Single Family Home $195k - $485k
The Bright MLS | T3 Home Demand Index for mid-priced single-family homes decreased to 101 in August reflecting a Steady pace of buyer interest. This segment accounted for one-third of sales over the month even with a very lean inventory of homes for sale. The months supply edged down to 1.3 and was the lowest of any segment of the Philadelphia Metro area market.

Monthly Statistics for Single Family Home $195k - $485k
Home Demand
Index
Index
101
(Steady)
Home Demand Index
from prior month
from prior month
107
Home Demand Index
from prior year
from prior year
129
Months of
Inventory
Inventory
1.3
Average daily inventory last month
2,953
Inventory sold
last month
last month
2,263
Bright MLS | T3 Home Demand Index
www.homedemandindex.com
Philadelphia | September 2022
Single Family Home Above $485k
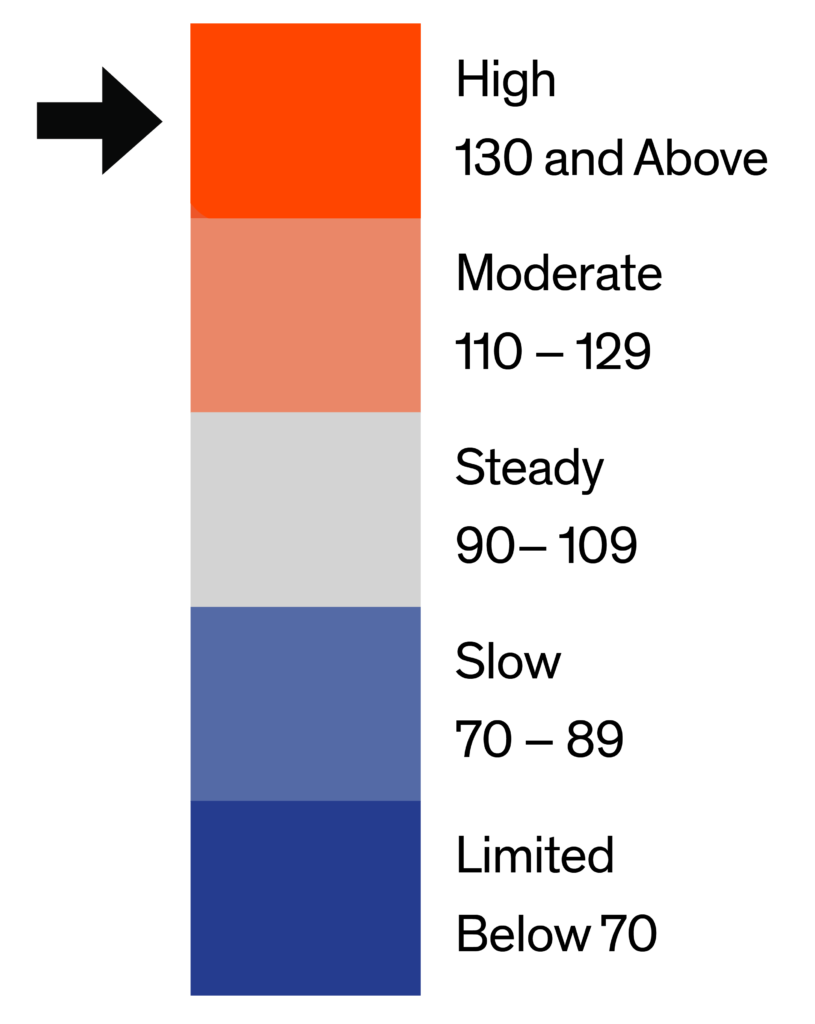
The Index for higher-priced single-family homes fell 14 percent in August to 179 but remained in the High range. Although down over the month, buyer interest was up slightly compared with one year earlier, the only segment of the Philadelphia Metro area market to exceed the previous year’s level of demand. The months supply of homes was down marginally to 1.5.

Monthly Statistics for Single Family Home Above $485k
Home Demand
Index
Index
179
(High)
Home Demand Index
from prior month
from prior month
209
Home Demand Index
from prior year
from prior year
176
Months of
Inventory
Inventory
1.5
Average daily inventory last month
2,202
Inventory sold
last month
last month
1,473
Bright MLS | T3 Home Demand Index
www.homedemandindex.com
Philadelphia | September 2022
Condo Below $360k
Demand for lower-priced condos changed little over the month and remained in the Steady range with an Index reading of 100. Demand was nearly one-fourth lower than one year earlier, however. The months supply was marginally lower at 1.9 months.

Monthly Statistics for Condo Below $360k
Home Demand
Index
Index
100
(Steady)
Home Demand Index
from prior month
from prior month
103
Home Demand Index
from prior year
from prior year
130
Months of
Inventory
Inventory
1.9
Average daily inventory last month
675
Inventory sold
last month
last month
355
Bright MLS | T3 Home Demand Index
www.homedemandindex.com
Philadelphia | September 2022
Condo Above $360k
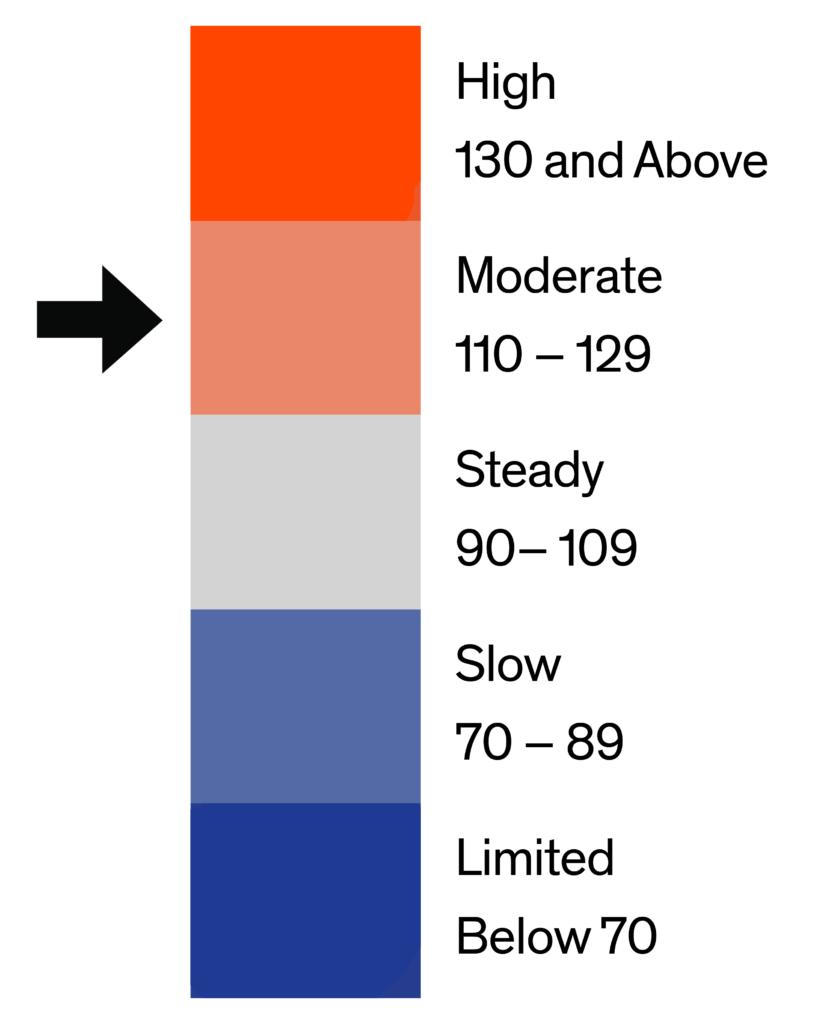
The Bright MLS | T3 Home Demand Index for higher-priced condos was somewhat higher in August and continued to reflect a Moderate pace of demand. The months supply rose to 5.5 from 4.8 in July, although the potential for volatility should be noted given the small number of sales each month.

Monthly Statistics for Condo Above $360k
Home Demand
Index
Index
124
(Moderate)
Home Demand Index
from prior month
from prior month
122
Home Demand Index
from prior year
from prior year
133
Months of
Inventory
Inventory
5.5
Average daily inventory last month
336
Inventory sold
last month
last month
61
Bright MLS | T3 Home Demand Index
www.homedemandindex.com
Philadelphia | September 2022
Townhouse/Rowhouse/Twin All prices
Townhouse/
Rowhouse/Twin
All prices
Demand for townhouses was down slightly in August. The Index, at 108, reflected a Steady pace of demand. The months supply was down marginally over the month to 2.4, a low level, but greater than all other segments except higher-priced condos.

Monthly Statistics for Townhouse/Rowhouse/TwinAll prices
Home Demand
Index
Index
108
(Steady)
Home Demand Index
from prior month
from prior month
112
Home Demand Index
from prior year
from prior year
122
Months of
Inventory
Inventory
2.4
Average daily inventory last month
6,327
Inventory sold
last month
last month
2,602
Bright MLS | T3 Home Demand Index
www.homedemandindex.com
Note
1. This report is generated with data from the following counties:
- Central Pennsylvania – Adams, PA; Berks, PA; Cumberland, PA; Dauphin, PA; Franklin, PA; Fulton, PA; Lancaster, PA; Lebanon, PA; Perry, PA; Schuylkill, PA; York, PA;
- Ocean County – Ocean, NJ;
- Philadelphia Metro – Bucks, PA; Burlington, NJ; Camden, NJ; Chester, PA; Delaware, PA; Gloucester, NJ; Kent, DE; Mercer, NJ; Montgomery, PA; New Castle, DE; Philadelphia, PA;
- Salem-Cumberland – Cumberland, NJ; Salem, NJ;
2. This report is for the September 2022 period with data collected from the previous month.
Released: September 11, 2022
Reference ID: 1677
Philadelphia | September 2022
Home Demand Map (Zip Codes)
In the Philadelphia Metro area, demand was strongest in Kent County, the only county in the High demand category in August. Buyer interest was Moderate or Steady across the rest of the Pennsylvania and Delaware counties in the metro area while demand was Slow in each of the suburban New Jersey counties. Buyer interest remained in the High range in the Salem-Cumberland market area and was at a Steady level in Central Pennsylvania. Across the Greater Philadelphia area demand was in the High category in 26 percent of ZIP codes compared with 31 percent in July. In 44 percent of ZIP codes, the Index was in the Slow or Limited range, an increase from 39 percent the previous month.

Bright MLS | T3 Home Demand Index
www.homedemandindex.com