Washington D.C. Metro
Metro Area Overview
Market Trend Map
Metro Area Overview
The current Home Demand Index (HDI) stands at 74, an increase from last month’s 65 but slightly below the 76 recorded during the same period last year. The month-over-month rise suggests a rebound in buyer interest, while the slight year-over-year decline indicates relatively stable demand. However, low inventory levels continue to constrain buyer options and moderate overall market activity.
The market trend line, below, provides a high-level monthly overview of the Home Demand Index for each of the metro market areas within the Greater Washington D.C. Metro Area. The Home Demand Index is baselined at 100, with 90-110 indicating a steady market. Index values above 110 indicate moderate and high activity while Index values below 90 indicate slower or limited activity. For more information for a given period of time, click on any point on the map to pull up the monthly report.
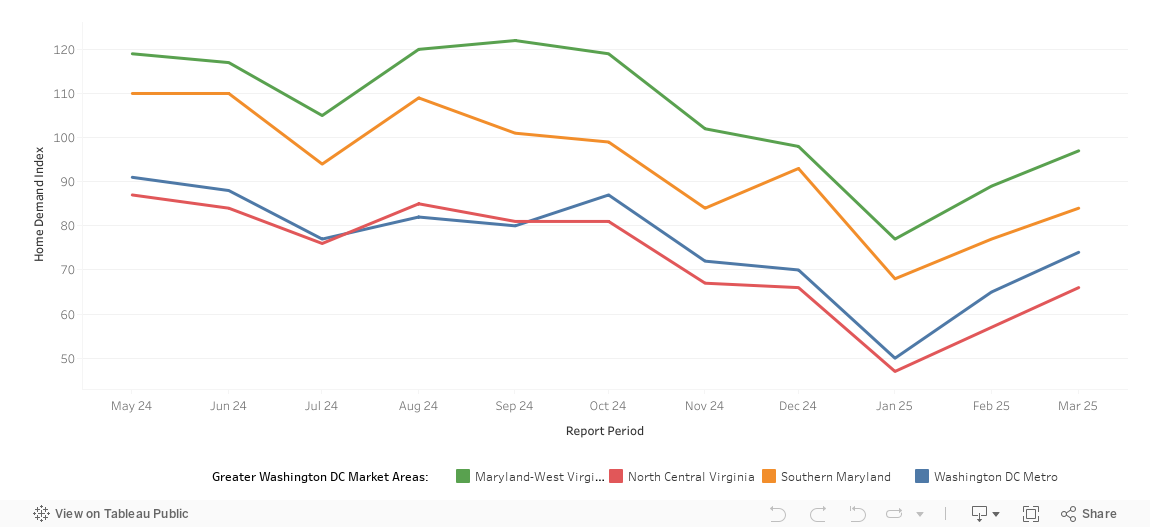
Metro Market Trend Data by Bright MLS | T3 Home Demand Index
Each of the market areas listed above are defined as follows:
- Maryland-West Virginia Panhandle – Allegany, MD; Berkeley, WV; Garrett, MD; Grant, WV; Hampshire, WV; Hardy, WV; Jefferson, WV; Mineral, WV; Morgan, WV; Pendleton, WV; Washington, MD;
- North Central Virginia – Caroline, VA; Clarke, VA; Culpeper, VA; Fauquier, VA; Frederick, VA; Fredericksburg City, VA; King George, VA; Madison, VA; Manassas City, VA; Orange, VA; Page, VA; Prince William, VA; Rappahannock, VA; Shenandoah, VA; Spotsylvania, VA; Stafford, VA; Warren, VA; Winchester City, VA;
- Southern Maryland – Calvert, MD; Charles, MD; Saint Marys, MD;
- Washington D.C. Metro – Alexandria City, VA; Arlington, VA; Fairfax, VA; Falls Church City, VA; Frederick, MD; Loudoun, VA; Montgomery, MD; Prince Georges, MD; Washington, DC;
Market Trend Map
The Market Trend Map for the Washington D.C. Metro pulls the county map from the monthly reports and combines to provide a time-lapse of the overall market. Use the navigation at the bottom to toggle between months.
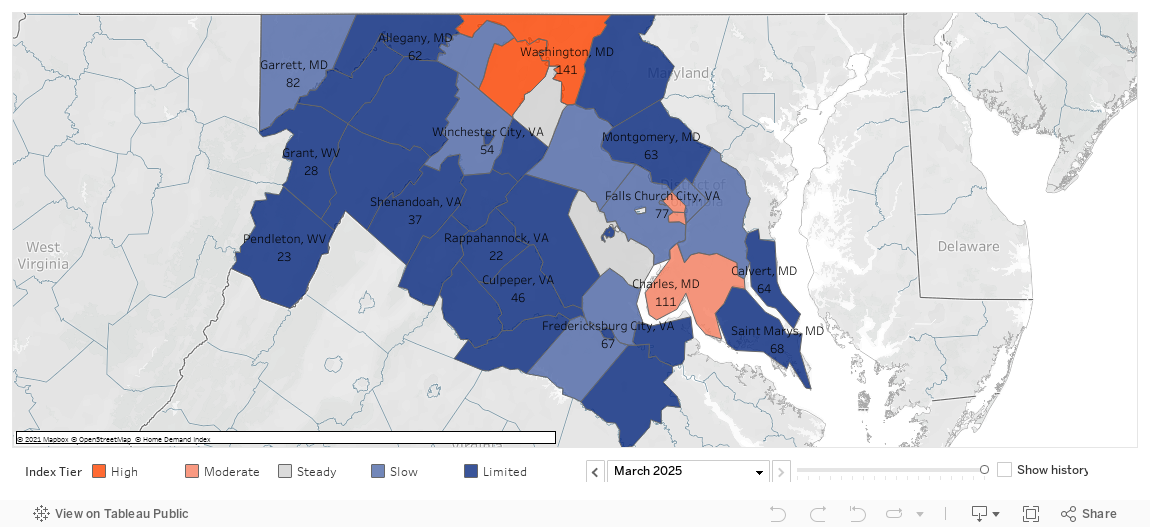
Washington D.C. Metro County-Level Market Trend Map | Home Demand Index
Current Market Report
Last 6 Market Reports
Historical Market Reports
Data Download
Washington D.C. | March 2025
Home Demand Index
The current Home Demand Index (HDI) stands at 74, an increase from last month’s 65 but slightly below the 76 recorded during the same period last year. The month-over-month rise suggests a rebound in buyer interest, while the slight year-over-year decline indicates relatively stable demand. However, low inventory levels continue to constrain buyer options and moderate overall market activity.
Demand for luxury single-family homes saw a sharp increase, rising to 89 from last month’s 63, indicating a significant shift in buyer interest. Mid-market single-family homes followed, reaching 61, up from 53 last month but down from 67 last year. The diverging trends across home segments suggest that mid-range and higher-end properties are experiencing stronger demand. This growth coincides with an increase in inventory compared to last month, potentially providing more options for buyers.

Monthly Statistics for March 2025
Home Demand
Index
Index
74
(Slow)
Home Demand Index
from prior month
from prior month
65
Home Demand Index
from prior year
from prior year
76
Index change
from prior month
from prior month
13.8%
Index change from
same time last year
same time last year
-2.6%
Bright MLS | T3 Home Demand Index
www.homedemandindex.com
Washington D.C. | February 2025
Home Demand Index
The Home Demand Index (HDI) for this report period is 63, showing an increase from last month’s 50. However, it remains slightly below last year’s index of 64. This suggests a moderate shift in market conditions, with month-over-month growth, yet a slight dip in demand compared to the previous year. The stability of the index reflects steady buyer interest, despite economic pressures, indicating that the market remains resilient overall.
Demand has increased across all home segments in the Washington metro area. Luxury condos saw the most significant increase, rising from 74 to 111, likely driven by a surge in buyer interest for high-end properties. Entry-level condos followed, climbing from 67 to 86. Townhouses rose from 53 to 64, while luxury single-family homes increased from 40 to 60. Mid-market homes rose from 51 to 59, and entry-level single-family homes saw a rise from 51 to 59. This broad uptick signals a market recovery, with the most notable increases in luxury condos and entry-level condos.

Monthly Statistics for February 2025
Home Demand
Index
Index
63
(Limited)
Home Demand Index
from prior month
from prior month
50
Home Demand Index
from prior year
from prior year
64
Index change
from prior month
from prior month
26%
Index change from
same time last year
same time last year
-1.6%
Bright MLS | T3 Home Demand Index
www.homedemandindex.com
Washington D.C. | January 2025
Home Demand Index
The current Home Demand Index (HDI) stands at 48, a significant decline from last month’s 69, but slightly higher than the 46 recorded during the same period last year. The drop from the previous month can be attributed to low inventory levels, which continue to limit buyer options and dampen market activity. Despite this short-term slowdown, the year-over-year increase suggests that demand remains stable, indicating that while current market conditions are challenging due to inventory constraints.
Demand for mid-market single-family homes decreased from 57 last month to 38 this period, showing a 6% increase compared to last year. Entry-level condos dropped from 88 last month to 66 this period, reflecting a 14% rise from last year. Luxury condos fell from 98 last month to 70 this period, with a 21% increase compared to last year. While town house decreased from 72 last month to 52 this period, they showed an 11% increase year-over-year. These trends suggest that certain market segments are holding strong despite the overall decline in demand from the previous month.
Monthly Statistics for January 2025
Home Demand
Index
Index
48
(Limited)
Home Demand Index
from prior month
from prior month
69
Home Demand Index
from prior year
from prior year
46
Index change
from prior month
from prior month
-30.4%
Index change from
same time last year
same time last year
4.3%
Bright MLS | T3 Home Demand Index
www.homedemandindex.com
Washington D.C. | December 2024
Home Demand Index
The Home Demand Index (HDI) for this report period is 68, reflecting a decrease from last month’s 71 but an improvement over last year’s index of 57. This trend indicates a slight cooling in market conditions month-over-month while maintaining steady year-over-year demand growth. The stability highlights consistent buyer interest despite broader economic pressures.
Demand for entry-level single-family homes remained stable, with the index slightly increasing to 67 from last month’s 66 and up from last year’s 61. In contrast, luxury single-family homes experienced the largest decline during this period, with the index at 61 compared to last month’s 75 and last year’s 63. These shifts indicate heightened market activity in the entry-level homes segment, while the luxury homes segment faces reduced demand.
Monthly Statistics for December 2024
Home Demand
Index
Index
68
(Limited)
Home Demand Index
from prior month
from prior month
71
Home Demand Index
from prior year
from prior year
57
Index change
from prior month
from prior month
-4.2%
Index change from
same time last year
same time last year
19.3%
Bright MLS | T3 Home Demand Index
www.homedemandindex.com
Washington D.C. | November 2024
Home Demand Index
The Home Demand Index (HDI) for this report period stands at 69, reflecting a decrease from last month’s 87 but an increase over last year’s index of 58. This shift indicates a softening of market conditions month-over-month, while demand remains slightly improved compared to the previous year. Overall, the year-over-year gain suggests buyer interest is steady despite recent economic adjustments.
Inventory levels have decreased across all home types, while sales activity has increased, indicating a growing demand that is outpacing supply. Demand for luxury condos has shifted from moderate to steady, reflecting consistent interest in the high-end market segment. This trend suggests that buyers are willing to invest in luxury condos, signaling confidence in the luxury market’s resilience amid changing economic conditions.
Monthly Statistics for November 2024
Home Demand
Index
Index
69
(Limited)
Home Demand Index
from prior month
from prior month
87
Home Demand Index
from prior year
from prior year
58
Index change
from prior month
from prior month
-20.7%
Index change from
same time last year
same time last year
19%
Bright MLS | T3 Home Demand Index
www.homedemandindex.com
Washington D.C. | October 2024
Home Demand Index
The Home Demand Index (HDI) for this report period stands at 85, reflecting a slight increase from last month’s 80 and a significant rise from last year’s index of 50. This trend suggests improving buyer activity, potentially influenced by favorable market conditions. The year-over-year growth highlights a stronger market, but the demand pace remains slow.
Buyer interest in all types of homes in the Washington D.C. metro area has increased. The index for luxury condos rose the most, up by 19%, followed by luxury single-family homes and townhouses, which both saw an 11% increase. Demand was strongest for luxury condos, attracting a moderate level of buyer interest. Conversely, demand was weakest for entry-level single-family homes, mid-market single-family homes, and townhouses, with buyer interest categorized as slow. The months of supply were higher for most types of homes, ranging from 1.8 months for mid-market single-family homes to 5 months for luxury condos.
Monthly Statistics for October 2024
Home Demand
Index
Index
85
(Slow)
Home Demand Index
from prior month
from prior month
80
Home Demand Index
from prior year
from prior year
50
Index change
from prior month
from prior month
6.3%
Index change from
same time last year
same time last year
70%
Bright MLS | T3 Home Demand Index
www.homedemandindex.com
Washington D.C. | September 2024
Home Demand Index
The Home Demand Index (HDI) for this report period stands at 77, which is unchanged from last year’s level but reflects a slight decline from last month’s 81. This trend suggests a softening of market conditions consistent with broader economic challenges impacting buyer activity. The year-over-year stability indicates that while demand remains subdued, it is not significantly worsening compared to last year.
The demand for single-family homes across various price points reflects a softening market trend, with entry-level and mid-range single-family homes both experiencing declines in buyer interest. Luxury single-family homes show a similar downward trend, albeit from a higher base of demand. Meanwhile, the condo market exhibits a relatively stable demand with minor fluctuations, and inventory levels remain constrained across all segments, maintaining a competitive market environment.
Monthly Statistics for September 2024
Home Demand
Index
Index
77
(Slow)
Home Demand Index
from prior month
from prior month
81
Home Demand Index
from prior year
from prior year
77
Index change
from prior month
from prior month
-4.9%
Index change from
same time last year
same time last year
0%
Bright MLS | T3 Home Demand Index
www.homedemandindex.com
All reports for the Washington D.C. Market Area.
List of available data files. Note that the data file includes all data for the report period across the entire Bright MLS footprint.