April 2025 Report
Washington D.C. Metro
Washington D.C. | April 2025
Home Demand Index
The current Home Demand Index (HDI) for Washington D.C. is 92, marking an increase from last month’s 77 and a slight rise from last year’s 87. This month-over-month improvement suggests growing buyer interest, possibly influenced by favorable market conditions or a shift in inventory levels. The year-over-year stability indicates that overall demand remains steady despite broader economic changes.
Demand for luxury single-family homes has surged, with the index increasing to 124 from last month’s 94, indicating significant buyer interest. Entry-level condos saw a smaller increase from last month’s 102 to 109, slightly higher than last year’s 104, reflecting ongoing affordability concerns. The substantial rise in mid-market demand suggests broader improvements in market conditions, while entry-level demand continues to be constrained by limited inventory and higher price sensitivity.

Monthly Statistics for April 2025
Home Demand
Index
Index
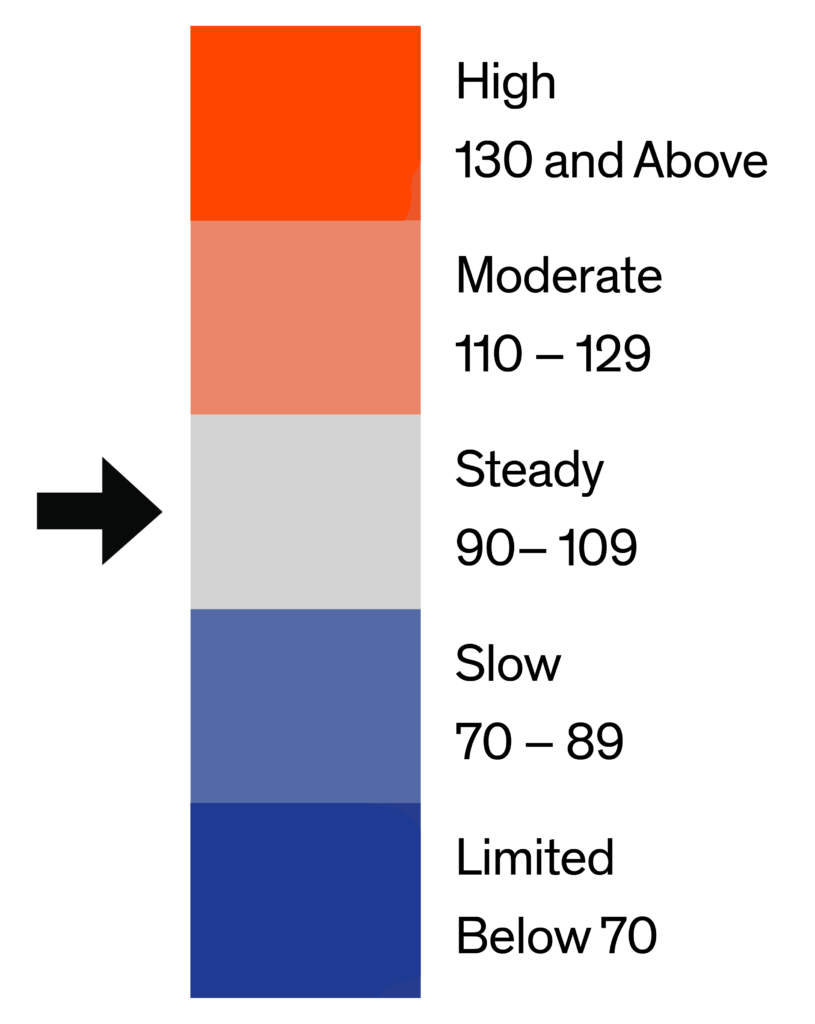
92
(Steady)
Home Demand Index
from prior month
from prior month
77
Home Demand Index
from prior year
from prior year
87
Index change
from prior month
from prior month
19.5%
Index change from
same time last year
same time last year
5.7%
Bright MLS | T3 Home Demand Index
www.homedemandindex.com
Washington D.C. | April 2025
Home Demand Index | Historical Year-over-Year Comparison
The Home Demand Index (HDI) for Washington D.C. this period stands at 92, a noticeable rise from last month’s 77 and above last year’s 87. The increase indicates stronger buyer interest compared to both the previous month and the same period last year, potentially reflecting positive seasonal or economic factors. This upward trend suggests a resilient market with continued buyer engagement despite ongoing economic challenges.
Home Demand Index
Bright MLS | T3 Home Demand Index
www.homedemandindex.com
Washington D.C. | April 2025
Home Demand Map
Buyer demand has increased across most metro areas this report period, particularly in core regions and suburban areas. The broad-based recovery suggests renewed buyer interest, likely driven by improved affordability and a favorable economic outlook. While inventory shortages continue to constrain the market, increased activity across various geographic areas indicates a more balanced and resilient demand pattern.
Bright MLS | T3 Home Demand Index
www.homedemandindex.com
Washington D.C. | April 2025
Demand and Inventory by Home Type
Demand for luxury single-family homes has surged, with the index increasing to 124 from last month’s 94, indicating significant buyer interest. Entry-level condos saw a smaller increase from last month’s 102 to 109, slightly higher than last year’s 104, reflecting ongoing affordability concerns. The substantial rise in mid-market demand suggests broader improvements in market conditions, while entry-level demand continues to be constrained by limited inventory and higher price sensitivity.
Bright MLS | T3 Home Demand Index
www.homedemandindex.com
Washington D.C. | April 2025
Single Family Home Below $555k
The index for entry-level single-family homes is 79, up from 69 last month and higher than last year’s 76. This increase from the previous month indicates a modest rise in buyer activity, with demand showing improvement compared to the same period last year. However, the category remains constrained, with ongoing inventory shortages and affordability concerns continuing to influence market conditions.

Monthly Statistics for Single Family Home Below $555k
Home Demand
Index
Index
79
(Slow)
Home Demand Index
from prior month
from prior month
69
Home Demand Index
from prior year
from prior year
76
Months of
inventory
inventory
2.4
Average daily inventory last month
854
Inventory sold
last month
last month
358
Bright MLS | T3 Home Demand Index
www.homedemandindex.com
Washington D.C. | April 2025
Single Family Home $555k - $1340k
The index for mid-range single-family homes stands at 84, up from 65 last month and higher than 78 last year. The month-over-month increase suggests a slight rebound in buyer activity, while the year-over-year rise indicates sustained demand. Despite fluctuations, the market for mid-range homes remains relatively stable, with consistent interest in this price range.

Monthly Statistics for Single Family Home $555k - $1340k
Home Demand
Index
Index
84
(Slow)
Home Demand Index
from prior month
from prior month
65
Home Demand Index
from prior year
from prior year
78
Months of
Inventory
Inventory
1.7
Average daily inventory last month
1,479
Inventory sold
last month
last month
846
Bright MLS | T3 Home Demand Index
www.homedemandindex.com
Washington D.C. | April 2025
Single Family Home Above $1340k
The index for luxury single-family homes is at 124, up from 94 last month and slightly lower than last year’s 125. The month-over-month increase suggests a recent boost in demand, while the year-over-year slight decline indicates relatively stable market conditions compared to the same period last year. This shift may reflect market adjustments or seasonal trends influencing luxury home demand.

Monthly Statistics for Single Family Home Above $1340k
Home Demand
Index
Index
124
(Moderate)
Home Demand Index
from prior month
from prior month
94
Home Demand Index
from prior year
from prior year
125
Months of
Inventory
Inventory
2.9
Average daily inventory last month
648
Inventory sold
last month
last month
223
Bright MLS | T3 Home Demand Index
www.homedemandindex.com
Washington D.C. | April 2025
Condo Below $589k
The index for entry-level condos is at 109, up from 102 last month and 104 last year. The month-over-month increase indicates growing demand, while the year-over-year rise reflects continued buyer interest in this segment. This upward trend may indicate stronger market conditions or improved affordability compared to other housing options, despite potential seasonal fluctuations.

Monthly Statistics for Condo Below $589k
Home Demand
Index
Index
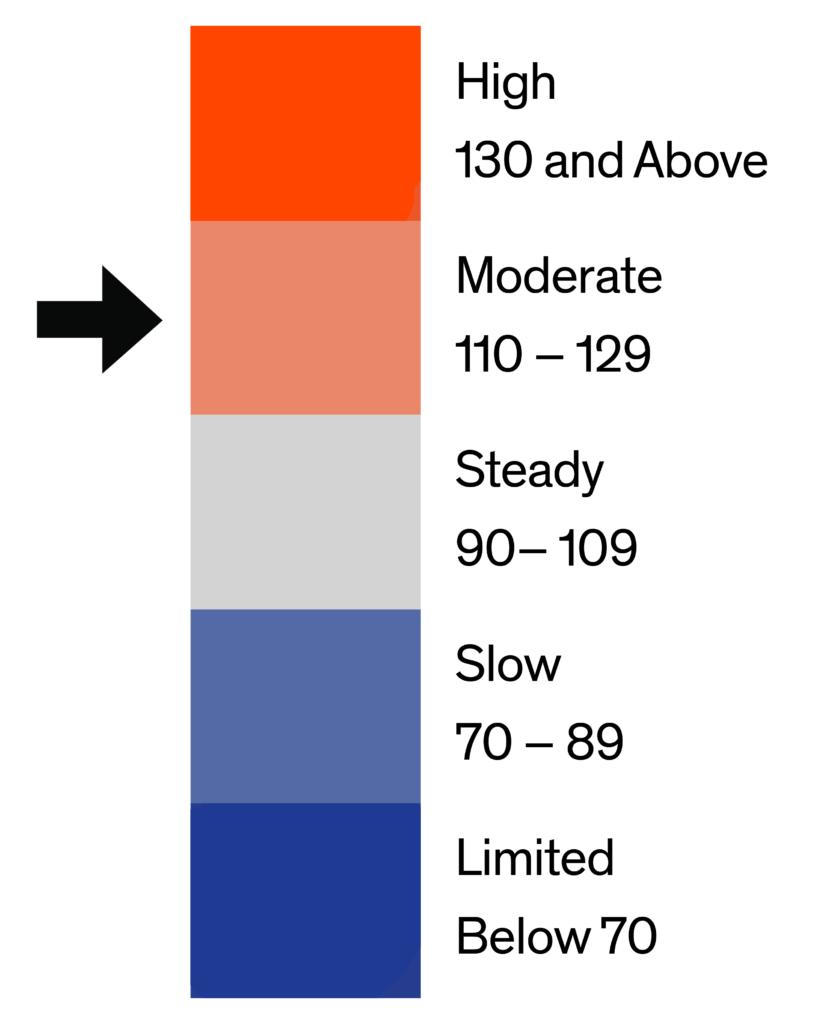
109
(Steady)
Home Demand Index
from prior month
from prior month
102
Home Demand Index
from prior year
from prior year
104
Months of
Inventory
Inventory
3.7
Average daily inventory last month
2,008
Inventory sold
last month
last month
550
Bright MLS | T3 Home Demand Index
www.homedemandindex.com
Washington D.C. | April 2025
Condo Above $589k
The index for luxury-level condos is 147, up from last month’s 125 and significantly higher than last year’s 128. The month-over-month increase suggests a continued recovery in demand, while the year-over-year rise indicates stronger activity in the luxury condo market compared to the same period last year. The luxury segment remains highly appealing to buyers, reflecting a clear increase in demand for high-end properties compared to the same period last year.

Monthly Statistics for Condo Above $589k
Home Demand
Index
Index
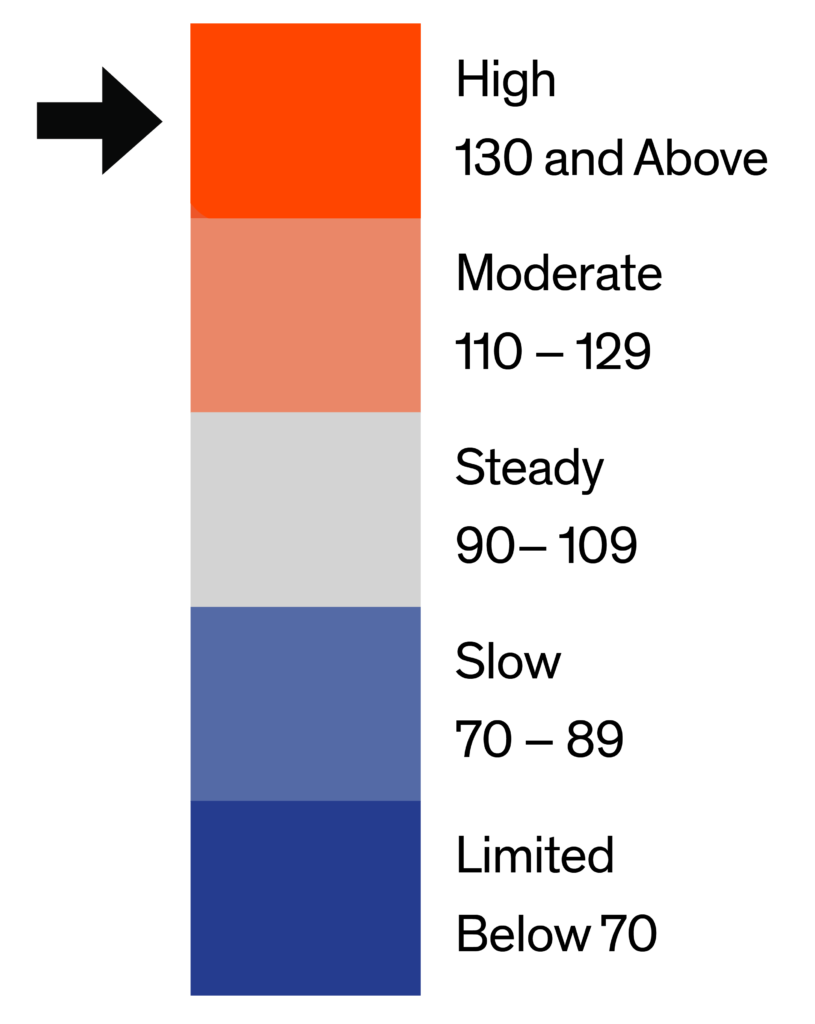
147
(High)
Home Demand Index
from prior month
from prior month
125
Home Demand Index
from prior year
from prior year
128
Months of
Inventory
Inventory
4.5
Average daily inventory last month
508
Inventory sold
last month
last month
114
Bright MLS | T3 Home Demand Index
www.homedemandindex.com
Washington D.C. | April 2025
Townhouse/Rowhouse/Twin All prices
Townhouse/
Rowhouse/Twin
All prices
The index for townhouses, rowhouses, and twins stands at 89, up from 76 last month and higher than last year’s 84. The month-over-month increase indicates a rebound in buyer interest, while the year-over-year rise suggests steady demand despite ongoing affordability challenges. Limited inventory and continued buyer preference for attached homes support this segment.

Monthly Statistics for Townhouse/Rowhouse/TwinAll prices
Home Demand
Index
Index
89
(Slow)
Home Demand Index
from prior month
from prior month
76
Home Demand Index
from prior year
from prior year
84
Months of
Inventory
Inventory
2.3
Average daily inventory last month
2,297
Inventory sold
last month
last month
978
Bright MLS | T3 Home Demand Index
www.homedemandindex.com
Note
1. This report is generated with data from the following counties:
- Maryland-West Virginia Panhandle – Allegany, MD; Berkeley, WV; Garrett, MD; Grant, WV; Hampshire, WV; Hardy, WV; Jefferson, WV; Mineral, WV; Morgan, WV; Pendleton, WV; Washington, MD;
- North Central Virginia – Caroline, VA; Clarke, VA; Culpeper, VA; Fauquier, VA; Frederick, VA; Fredericksburg City, VA; King George, VA; Madison, VA; Manassas City, VA; Orange, VA; Page, VA; Prince William, VA; Rappahannock, VA; Shenandoah, VA; Spotsylvania, VA; Stafford, VA; Warren, VA; Winchester City, VA;
- Southern Maryland – Calvert, MD; Charles, MD; Saint Marys, MD;
- Washington D.C. Metro – Alexandria City, VA; Arlington, VA; Fairfax, VA; Falls Church City, VA; Frederick, MD; Loudoun, VA; Montgomery, MD; Prince Georges, MD; Washington, DC;
2. This report is for the April 2025 period with data collected from the previous month.
Released: April 10, 2025
Reference ID: 2225
Washington D.C. | April 2025
Home Demand Map (Zip Codes)
Buyer demand has increased across most metro areas this report period, particularly in core regions and suburban areas. The broad-based recovery suggests renewed buyer interest, likely driven by improved affordability and a favorable economic outlook. While inventory shortages continue to constrain the market, increased activity across various geographic areas indicates a more balanced and resilient demand pattern.

Bright MLS | T3 Home Demand Index
www.homedemandindex.com