December 2024 Report
Washington D.C. Metro
Washington D.C. | December 2024
Home Demand Index
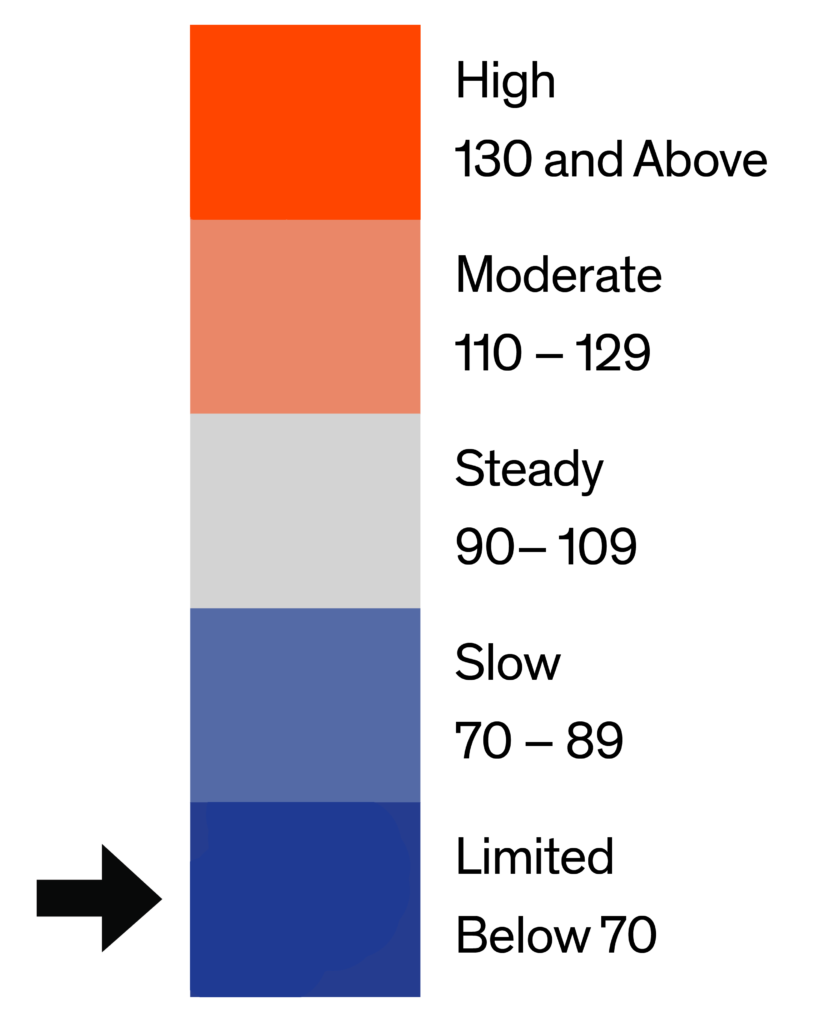
The Home Demand Index (HDI) for this report period is 68, reflecting a decrease from last month’s 71 but an improvement over last year’s index of 57. This trend indicates a slight cooling in market conditions month-over-month while maintaining steady year-over-year demand growth. The stability highlights consistent buyer interest despite broader economic pressures.
Demand for entry-level single-family homes remained stable, with the index slightly increasing to 67 from last month’s 66 and up from last year’s 61. In contrast, luxury single-family homes experienced the largest decline during this period, with the index at 61 compared to last month’s 75 and last year’s 63. These shifts indicate heightened market activity in the entry-level homes segment, while the luxury homes segment faces reduced demand.

Monthly Statistics for December 2024
Home Demand
Index
Index
68
(Limited)
Home Demand Index
from prior month
from prior month
71
Home Demand Index
from prior year
from prior year
57
Index change
from prior month
from prior month
-4.2%
Index change from
same time last year
same time last year
19.3%
Bright MLS | T3 Home Demand Index
www.homedemandindex.com
Washington D.C. | December 2024
Home Demand Index | Historical Year-over-Year Comparison
The HDI for this report period is 68, slightly down from last month’s 71 but significantly higher than last year’s 57. This year-over-year improvement underscores stronger buyer interest compared to the previous year. The month-over-month decline suggests potential seasonal adjustments or ongoing economic influences on buyer activity.
Home Demand Index
Bright MLS | T3 Home Demand Index
www.homedemandindex.com
Washington D.C. | December 2024
Home Demand Map
Demand has softened across most regions this month, with notable slowdowns in surrounding counties compared to steady activity levels in core metro areas. While some regions maintain moderate interest, limited buyer engagement is observed in outlying areas. This trend reflects a cooling regional market impacted by inventory constraints and economic factors.
Bright MLS | T3 Home Demand Index
www.homedemandindex.com
Washington D.C. | December 2024
Demand and Inventory by Home Type
Demand for entry-level single-family homes remained stable, with the index slightly increasing to 67 from last month’s 66 and up from last year’s 61. In contrast, luxury single-family homes experienced the largest decline during this period, with the index at 61 compared to last month’s 75 and last year’s 63. These shifts indicate heightened market activity in the entry-level homes segment, while the luxury homes segment faces reduced demand.
Bright MLS | T3 Home Demand Index
www.homedemandindex.com
Washington D.C. | December 2024
Single Family Home Below $550k
The entry-level single-family home index stands at 67, an increase from last month’s 66 and higher than last year’s 61. This stability reflects consistent buyer interest despite broader market adjustments. Limited inventory continues to contribute to competitive market conditions in this segment.

Monthly Statistics for Single Family Home Below $550k
Home Demand
Index
Index
67
(Limited)
Home Demand Index
from prior month
from prior month
66
Home Demand Index
from prior year
from prior year
61
Months of
inventory
inventory
2.4
Average daily inventory last month
907
Inventory sold
last month
last month
372
Bright MLS | T3 Home Demand Index
www.homedemandindex.com
Washington D.C. | December 2024
Single Family Home $550k - $1325k
The index for mid-range single-family homes is 56, down from last month’s 61 but up from last year’s 48. This decrease in demand suggests a slight softening in buyer interest compared to last month, although it still reflects an improvement over last year. The market for mid-range homes continues to show modest recovery, but competition remains relatively weak in this segment.

Monthly Statistics for Single Family Home $550k - $1325k
Home Demand
Index
Index
56
(Limited)
Home Demand Index
from prior month
from prior month
61
Home Demand Index
from prior year
from prior year
48
Months of
Inventory
Inventory
1.9
Average daily inventory last month
1,626
Inventory sold
last month
last month
859
Bright MLS | T3 Home Demand Index
www.homedemandindex.com
Washington D.C. | December 2024
Single Family Home Above $1325k
The index for luxury single-family homes is 61, reflecting a decline from last month’s 75 and a slight decrease from last year’s 63. This suggests weakening buyer interest in the high-end home segment, likely influenced by affordability constraints or shifting market dynamics. Despite some ongoing interest, the demand softening is evident, indicating challenges in maintaining momentum within this segment.

Monthly Statistics for Single Family Home Above $1325k
Home Demand
Index
Index
61
(Limited)
Home Demand Index
from prior month
from prior month
75
Home Demand Index
from prior year
from prior year
63
Months of
Inventory
Inventory
2.7
Average daily inventory last month
618
Inventory sold
last month
last month
226
Bright MLS | T3 Home Demand Index
www.homedemandindex.com
Washington D.C. | December 2024
Condo Below $590k
The entry-level condo index stands at 86, reflecting a slight decrease from last month’s 88 but a significant increase from last year’s 70. This stable demand indicates that buyer interest in affordable condos remains solid, although slightly softer than the previous month. The year-over-year increase highlights the continued resilience of the entry-level condo market amid broader economic recovery.

Monthly Statistics for Condo Below $590k
Home Demand
Index
Index
86
(Slow)
Home Demand Index
from prior month
from prior month
88
Home Demand Index
from prior year
from prior year
70
Months of
Inventory
Inventory
3.5
Average daily inventory last month
1,995
Inventory sold
last month
last month
572
Bright MLS | T3 Home Demand Index
www.homedemandindex.com
Washington D.C. | December 2024
Condo Above $590k
The luxury condo index stands at 97, reflecting a slight decrease from last month’s 99 but an increase from last year’s 73. This steady demand suggests that while interest in the luxury condo market remains relatively strong, it has softened slightly compared to the previous month. The year-over-year growth indicates that the market is gradually improving, with buyers continuing to show interest in this segment despite potential economic challenges.

Monthly Statistics for Condo Above $590k
Home Demand
Index
Index
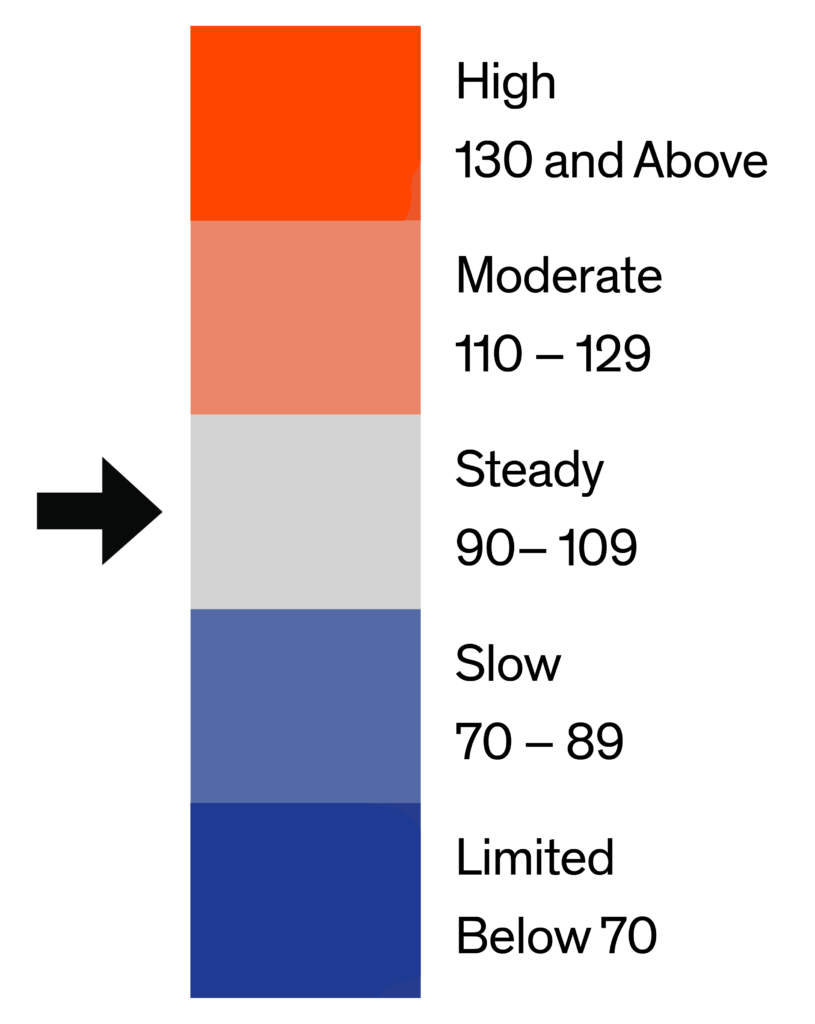
97
(Steady)
Home Demand Index
from prior month
from prior month
99
Home Demand Index
from prior year
from prior year
73
Months of
Inventory
Inventory
4.6
Average daily inventory last month
460
Inventory sold
last month
last month
99
Bright MLS | T3 Home Demand Index
www.homedemandindex.com
Washington D.C. | December 2024
Townhouse/Rowhouse/Twin All prices
Townhouse/
Rowhouse/Twin
All prices
The index for townhouses, rowhouses, and twins stands at 71 for this report period, a decrease from last month’s 75 but significantly higher than last year’s 56. This reflects a slow pace of buyer interest, consistent with overall market softness. The decline from last month suggests ongoing challenges in attracting buyers, though the year-over-year improvement points to positive movement in demand, potentially driven by slight inventory gains

Monthly Statistics for Townhouse/Rowhouse/TwinAll prices
Home Demand
Index
Index
71
(Slow)
Home Demand Index
from prior month
from prior month
75
Home Demand Index
from prior year
from prior year
56
Months of
Inventory
Inventory
2.7
Average daily inventory last month
2,597
Inventory sold
last month
last month
980
Bright MLS | T3 Home Demand Index
www.homedemandindex.com
Note
1. This report is generated with data from the following counties:
- Maryland-West Virginia Panhandle – Allegany, MD; Berkeley, WV; Garrett, MD; Grant, WV; Hampshire, WV; Hardy, WV; Jefferson, WV; Mineral, WV; Morgan, WV; Pendleton, WV; Washington, MD;
- North Central Virginia – Caroline, VA; Clarke, VA; Culpeper, VA; Fauquier, VA; Frederick, VA; Fredericksburg City, VA; King George, VA; Madison, VA; Manassas City, VA; Orange, VA; Page, VA; Prince William, VA; Rappahannock, VA; Shenandoah, VA; Spotsylvania, VA; Stafford, VA; Warren, VA; Winchester City, VA;
- Southern Maryland – Calvert, MD; Charles, MD; Saint Marys, MD;
- Washington D.C. Metro – Alexandria City, VA; Arlington, VA; Fairfax, VA; Falls Church City, VA; Frederick, MD; Loudoun, VA; Montgomery, MD; Prince Georges, MD; Washington, DC;
2. This report is for the December 2024 period with data collected from the previous month.
Released: December 10, 2024
Reference ID: 2160
Washington D.C. | December 2024
Home Demand Map (Zip Codes)
Demand has softened across most regions this month, with notable slowdowns in surrounding counties compared to steady activity levels in core metro areas. While some regions maintain moderate interest, limited buyer engagement is observed in outlying areas. This trend reflects a cooling regional market impacted by inventory constraints and economic factors.

Bright MLS | T3 Home Demand Index
www.homedemandindex.com