July 2024 Report
Washington D.C. Metro
Washington D.C. | July 2024
Home Demand Index
The Home Demand Index (HDI) for this report period stands at 74, indicating a continued slow pace of buyer interest in the overall market. This represents a decline from last month’s index of 87 and is significantly lower than the index of 91 recorded one year ago. The downward trend underscores the ongoing softening of market conditions due to evolving economic factors.
In the current report period, the Home Demand Index shows varied buyer interest across different home types in the Washington D.C. Metro area. Demand for luxury single-family homes and condos remained robust, with these segments experiencing the highest levels of buyer activity. Despite strong demand, inventory levels remained constrained across all segments, leading to competitive market conditions.

Monthly Statistics for July 2024
Home Demand
Index
Index
74
(Slow)
Home Demand Index
from prior month
from prior month
87
Home Demand Index
from prior year
from prior year
91
Index change
from prior month
from prior month
-14.9%
Index change from
same time last year
same time last year
-18.7%
Bright MLS | T3 Home Demand Index
www.homedemandindex.com
Washington D.C. | July 2024
Home Demand Index | Historical Year-over-Year Comparison
The Home Demand Index (HDI) for Washington D.C. this report period shows a decline to 74 from last month’s 87 and is significantly lower than the 91 recorded in the same period last year. This consistent decline indicates a softening in market demand over the past year. Despite periodic fluctuations, the overall trend reflects ongoing challenges in maintaining buyer interest due to higher mortgage rates and limited inventory.
Home Demand Index
Bright MLS | T3 Home Demand Index
www.homedemandindex.com
Washington D.C. | July 2024
Home Demand Map
Demand for homes was strongest in the Maryland-West Virginia Panhandle, with an HDI of 103, categorized as “Steady,” indicating consistently modest buyer interest. This was followed by Southern Maryland, with an HDI standing at 92, also classified as “Steady.” The Washington Metro area and North Central Virginia fall into the category of “Slow,” with HDIs of 74 and 73, respectively, reflecting consistently weak buyer activity.
Bright MLS | T3 Home Demand Index
www.homedemandindex.com
Washington D.C. | July 2024
Demand and Inventory by Home Type
In the current report period, the Home Demand Index shows varied buyer interest across different home types in the Washington D.C. Metro area. Demand for luxury single-family homes and condos remained robust, with these segments experiencing the highest levels of buyer activity. Despite strong demand, inventory levels remained constrained across all segments, leading to competitive market conditions.
Bright MLS | T3 Home Demand Index
www.homedemandindex.com
Washington D.C. | July 2024
Single Family Home Below $540k
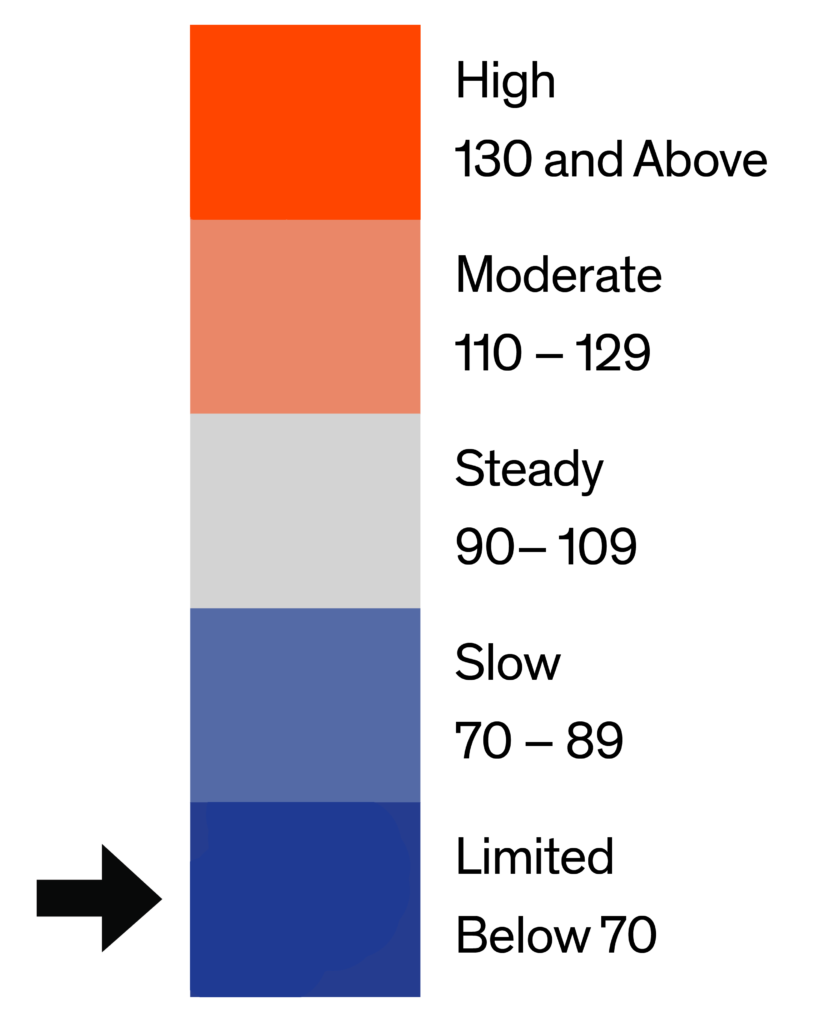
For entry-level single-family homes, the Home Demand Index (HDI) is 65 for this report period, reflecting a 7% decrease from last month’s 70 and a significant drop from last year’s 74. This indicates a limited pace of buyer interest, consistent with the broader market’s cooling trend. The months supply of homes remained stable, highlighting ongoing inventory constraints in this segment.

Monthly Statistics for Single Family Home Below $540k
Home Demand
Index
Index
65
(Limited)
Home Demand Index
from prior month
from prior month
70
Home Demand Index
from prior year
from prior year
74
Months of
inventory
inventory
1.7
Average daily inventory last month
669
Inventory sold
last month
last month
383
Bright MLS | T3 Home Demand Index
www.homedemandindex.com
Washington D.C. | July 2024
Single Family Home $540k - $1300k
For mid-range single-family homes, the Home Demand Index (HDI) is 71 for this report period, showing a 13% decline from last month’s 82 and a decrease from last year’s 85. This segment continues to reflect a slow pace of buyer interest, indicative of softening demand. The months supply of homes remains tight, underscoring limited inventory despite the drop in demand.

Monthly Statistics for Single Family Home $540k - $1300k
Home Demand
Index
Index
71
(Slow)
Home Demand Index
from prior month
from prior month
82
Home Demand Index
from prior year
from prior year
85
Months of
Inventory
Inventory
1.1
Average daily inventory last month
1,421
Inventory sold
last month
last month
1,272
Bright MLS | T3 Home Demand Index
www.homedemandindex.com
Washington D.C. | July 2024
Single Family Home Above $1300k
For luxury single-family homes, the Home Demand Index (HDI) stands at 95 for this report period, indicating a notable decrease from last month’s 128 and last year’s 125. This reflects a moderate level of demand despite the decline, likely influenced by market adjustments. The months supply of homes remains low, maintaining interest in this high-end segment.

Monthly Statistics for Single Family Home Above $1300k
Home Demand
Index
Index
95
(Steady)
Home Demand Index
from prior month
from prior month
128
Home Demand Index
from prior year
from prior year
125
Months of
Inventory
Inventory
1.6
Average daily inventory last month
682
Inventory sold
last month
last month
421
Bright MLS | T3 Home Demand Index
www.homedemandindex.com
Washington D.C. | July 2024
Condo Below $575k
For entry-level condos, the Home Demand Index (HDI) is 85 for this report period, showing a significant decrease from last month’s 103 and last year’s 104. This indicates a steady but declining level of buyer interest, aligning with broader market trends favoring more affordable urban living. The months supply of homes remains unchanged, maintaining tight inventory conditions.

Monthly Statistics for Condo Below $575k
Home Demand
Index
Index
85
(Slow)
Home Demand Index
from prior month
from prior month
103
Home Demand Index
from prior year
from prior year
104
Months of
Inventory
Inventory
2.2
Average daily inventory last month
1,462
Inventory sold
last month
last month
673
Bright MLS | T3 Home Demand Index
www.homedemandindex.com
Washington D.C. | July 2024
Condo Above $575k
For luxury condos, the Home Demand Index (HDI) stands at 102 for this report period, reflecting a substantial drop from last month’s 125 and last year’s 140. This decline signifies a moderation in buyer interest, possibly due to market adjustments or seasonal variations. Despite this, inventory remains relatively low, with a 2.9 months supply of homes.

Monthly Statistics for Condo Above $575k
Home Demand
Index
Index
102
(Steady)
Home Demand Index
from prior month
from prior month
125
Home Demand Index
from prior year
from prior year
140
Months of
Inventory
Inventory
3
Average daily inventory last month
399
Inventory sold
last month
last month
133
Bright MLS | T3 Home Demand Index
www.homedemandindex.com
Washington D.C. | July 2024
Townhouse/Rowhouse/Twin All prices
Townhouse/
Rowhouse/Twin
All prices
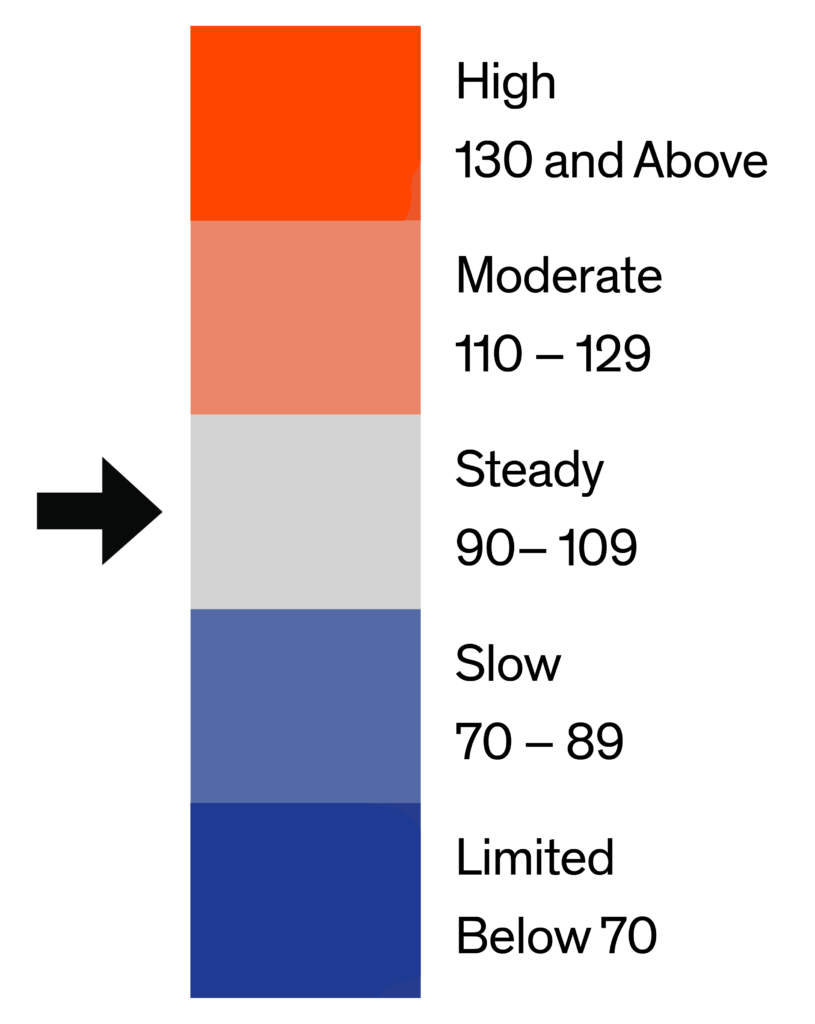
The Home Demand Index (HDI) for townhouses, rowhouses, and twins is 72 for this report period, down from 84 last month and 91 one year ago. This segment continues to reflect a slow pace of buyer interest, indicative of market softness. The months supply of homes has increased slightly, yet inventory remains low despite the increase.

Monthly Statistics for Townhouse/Rowhouse/TwinAll prices
Home Demand
Index
Index
72
(Slow)
Home Demand Index
from prior month
from prior month
84
Home Demand Index
from prior year
from prior year
91
Months of
Inventory
Inventory
1.5
Average daily inventory last month
1,962
Inventory sold
last month
last month
1,281
Bright MLS | T3 Home Demand Index
www.homedemandindex.com
Note
1. This report is generated with data from the following counties:
- Maryland-West Virginia Panhandle – Allegany, MD; Berkeley, WV; Garrett, MD; Grant, WV; Hampshire, WV; Hardy, WV; Jefferson, WV; Mineral, WV; Morgan, WV; Pendleton, WV; Washington, MD;
- North Central Virginia – Caroline, VA; Clarke, VA; Culpeper, VA; Fauquier, VA; Frederick, VA; Fredericksburg City, VA; King George, VA; Madison, VA; Manassas City, VA; Orange, VA; Page, VA; Prince William, VA; Rappahannock, VA; Shenandoah, VA; Spotsylvania, VA; Stafford, VA; Warren, VA; Winchester City, VA;
- Southern Maryland – Calvert, MD; Charles, MD; Saint Marys, MD;
- Washington D.C. Metro – Alexandria City, VA; Arlington, VA; Fairfax, VA; Falls Church City, VA; Frederick, MD; Loudoun, VA; Montgomery, MD; Prince Georges, MD; Washington, DC;
2. This report is for the July 2024 period with data collected from the previous month.
Released: July 10, 2024
Reference ID: 2076
Washington D.C. | July 2024
Home Demand Map (Zip Codes)
Demand for homes was strongest in the Maryland-West Virginia Panhandle, with an HDI of 103, categorized as “Steady,” indicating consistently modest buyer interest. This was followed by Southern Maryland, with an HDI standing at 92, also classified as “Steady.” The Washington Metro area and North Central Virginia fall into the category of “Slow,” with HDIs of 74 and 73, respectively, reflecting consistently weak buyer activity.

Bright MLS | T3 Home Demand Index
www.homedemandindex.com