March 2022 Report
Washington D.C. Metro
Washington D.C. | March 2022
Home Demand Index
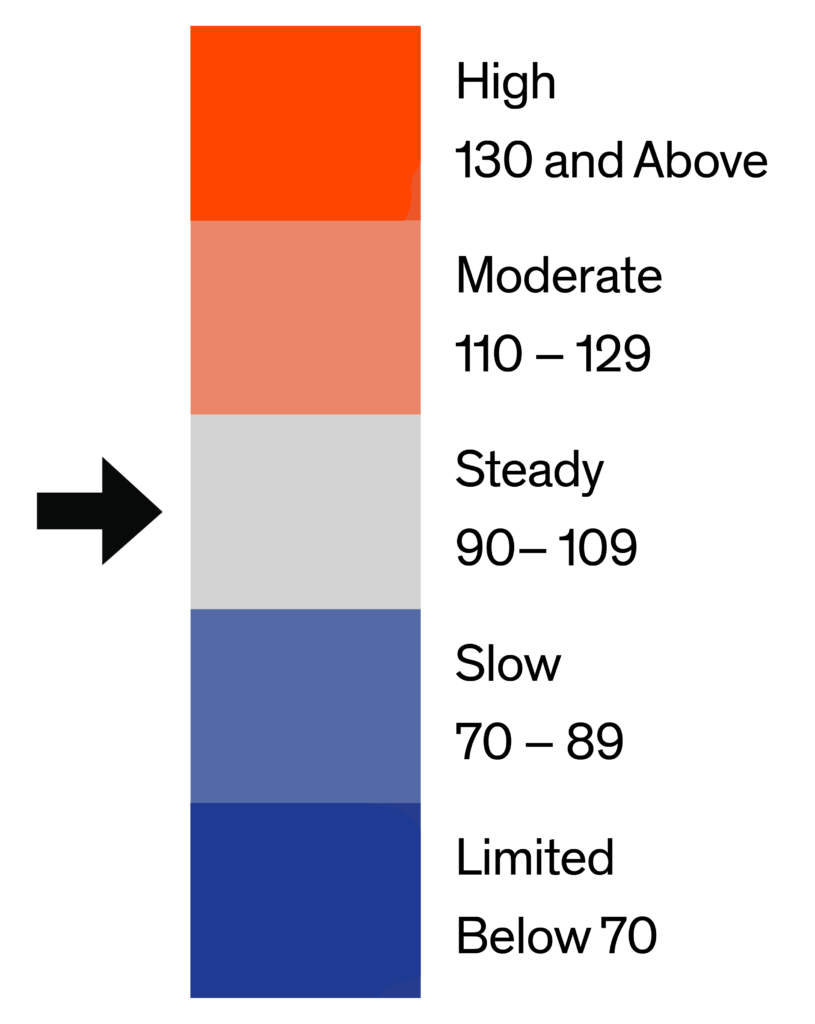
The Bright MLS | T3 Home Demand Index for the Washington Metro area increased by slightly more than 27 percent in February to 108. Buyer interest was at a Steady pace over the month compared with Slow demand in January.
In February, the Index rose for each type of home with the greatest increases in mid- and higher-priced single-family homes. Demand was strongest for higher-priced single-family homes and higher-priced condos, each with a high level of buyer interest. Overall, inventory conditions were tighter in February compared with January. The monthly supply decreased for higher-priced single-family homes, condos and townhouses. Inventory levels ranged from a one-month supply for townhouses and mid-priced single-family homes to a 2.5 months supply for higher-priced condos.

Monthly Statistics for March 2022
Home Demand
Index
Index
108
(Steady)
Home Demand Index
from prior month
from prior month
85
Home Demand Index
from prior year
from prior year
116
Index change
from prior month
from prior month
27.1%
Index change from
same time last year
same time last year
-6.9%
Bright MLS | T3 Home Demand Index
www.homedemandindex.com
Washington D.C. | March 2022
Home Demand Index | Historical Year-over-Year Comparison
Demand for Washington Metro area homes rose for the second consecutive month in February following the seasonal decline in buyer activity at the end of the year. The Index’s two-month gain of more than 50 percent reflected rising buyer interest in the early months of the spring market when home search activity usually intensifies. Despite the increases, the Index was nearly seven percent lower than the same month one year earlier.
Home Demand Index
Bright MLS | T3 Home Demand Index
www.homedemandindex.com
Washington D.C. | March 2022
Home Demand Map
Buyer interest in Arlington County and Alexandria City homes remained in the High category in February. Demand was Moderate in Fairfax and Prince Georges counties. Other counties in the Washington Metro area recorded buyer demand ranging from Steady in Loudoun and Montgomery counties to Limited in Falls Church City. Demand was Moderate in Southern Maryland and the Maryland-West Virginia Panhandle market area and Steady in the North Central Virginia region. Across the Greater Washington area, demand in 27 percent of ZIP codes was in the High range compared with 16 percent in January. At the same time, the share of ZIP codes with Limited demand fell from 47 percent in January to 37 percent in February.
Bright MLS | T3 Home Demand Index
www.homedemandindex.com
Washington D.C. | March 2022
Demand and Inventory by Home Type
In February, the Index rose for each type of home with the greatest increases in mid- and higher-priced single-family homes. Demand was strongest for higher-priced single-family homes and higher-priced condos, each with a high level of buyer interest. Overall, inventory conditions were tighter in February compared with January. The monthly supply decreased for higher-priced single-family homes, condos and townhouses. Inventory levels ranged from a one-month supply for townhouses and mid-priced single-family homes to a 2.5 months supply for higher-priced condos.
Bright MLS | T3 Home Demand Index
www.homedemandindex.com
Washington D.C. | March 2022
Single Family Home Below $395k
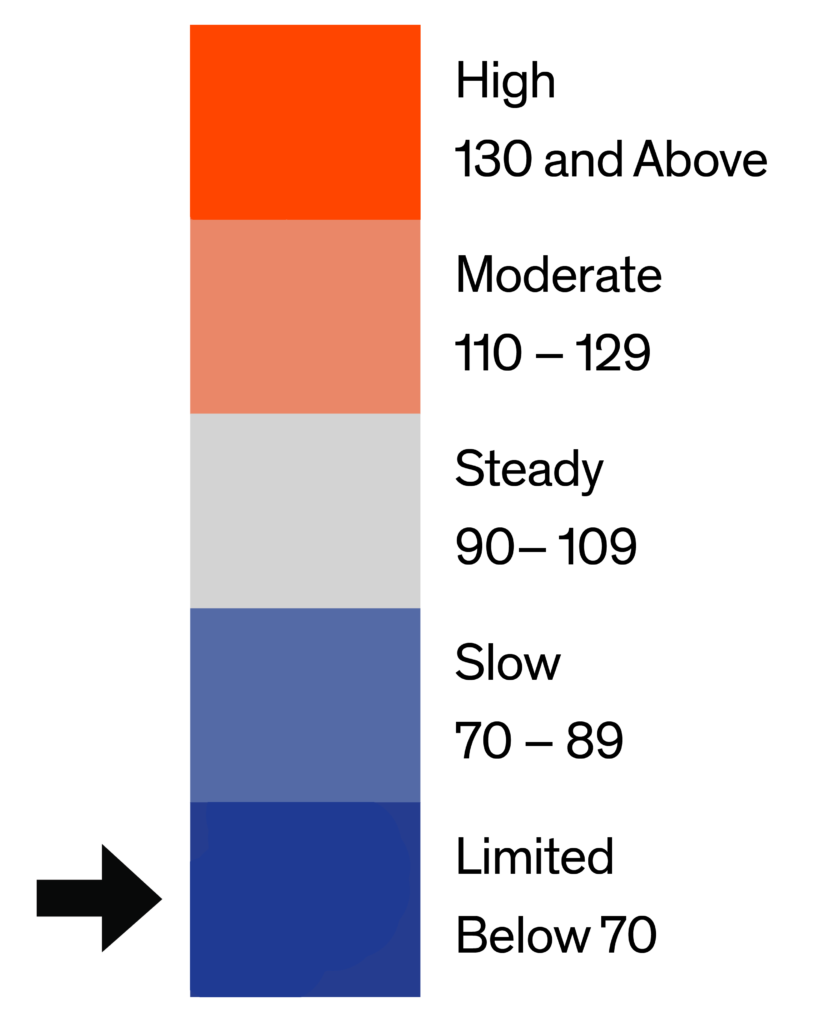
Demand for lower-priced single-family homes increased in January, although remaining in the Limited range. The Bright MLS | T3 Home Demand Index rose 18 percent to 46. Compared with one year earlier, the Index was 40 percent lower reflecting the persistent weakness in demand in this segment of the Washington Metro market. Even with weak demand, the inventory of homes for sale was equivalent to just 1.5 months supply, up slightly from January but still very low.

Monthly Statistics for Single Family Home Below $395k
Home Demand
Index
Index
46
(Limited)
Home Demand Index
from prior month
from prior month
39
Home Demand Index
from prior year
from prior year
77
Months of
inventory
inventory
1.5
Average daily inventory last month
306
Inventory sold
last month
last month
204
Bright MLS | T3 Home Demand Index
www.homedemandindex.com
Washington D.C. | March 2022
Single Family Home $395k - $950k
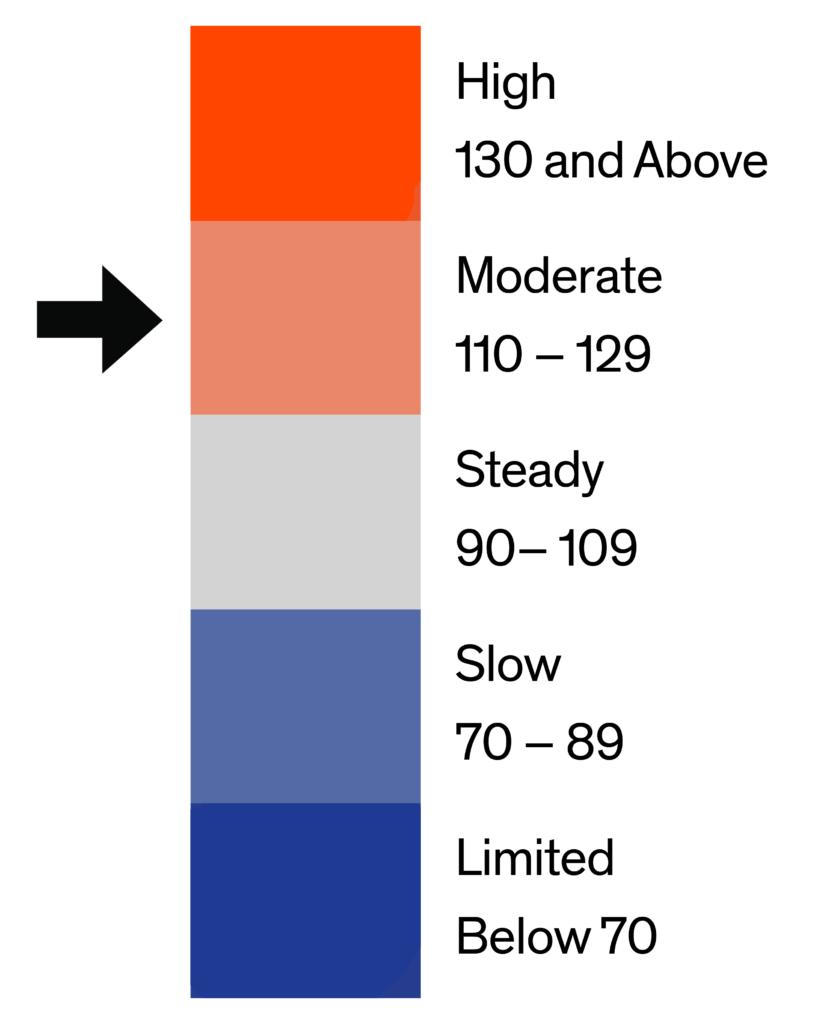
Buyer interest in mid-priced single-family homes increased to a Moderate pace in February from a Slow pace in January. The Index, at 110, was up by one-third and was only slightly lower than the level one year earlier. Inventory remained relatively low with a one-month supply of homes on the market, unchanged from January.

Monthly Statistics for Single Family Home $395k - $950k
Home Demand
Index
Index
110
(Moderate)
Home Demand Index
from prior month
from prior month
82
Home Demand Index
from prior year
from prior year
116
Months of
Inventory
Inventory
1
Average daily inventory last month
878
Inventory sold
last month
last month
908
Bright MLS | T3 Home Demand Index
www.homedemandindex.com
Washington D.C. | March 2022
Single Family Home Above $950k
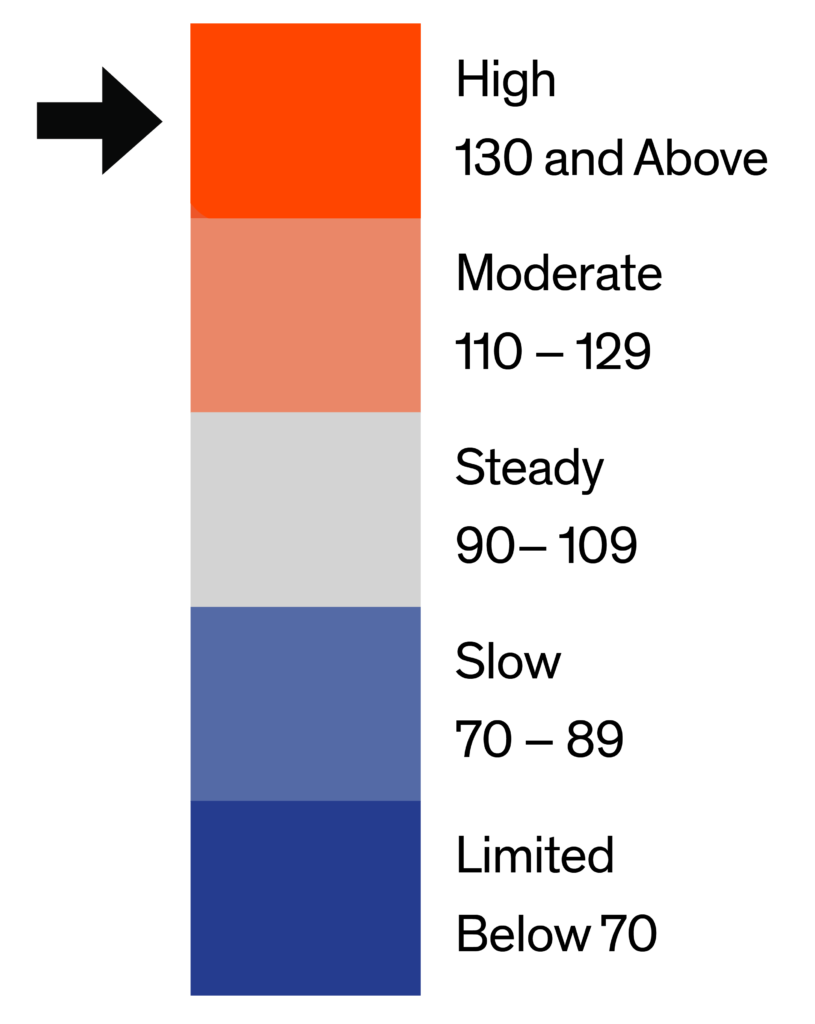
Demand for higher-priced single-family homes increased by more than 50 percent in February, according to the Bright MLS | T3 Home Demand Index. The Index, at 202, was well above the threshold for High demand and nearly one-third higher than the level one year earlier. Buyer interest in this segment has been consistently strong over the past several months and the latest Index reading confirms that trend continues. The months supply decreased to 1.4 from 1.7 months in January, further confirming the elevated pace of demand.

Monthly Statistics for Single Family Home Above $950k
Home Demand
Index
Index
202
(High)
Home Demand Index
from prior month
from prior month
128
Home Demand Index
from prior year
from prior year
155
Months of
Inventory
Inventory
1.4
Average daily inventory last month
459
Inventory sold
last month
last month
318
Bright MLS | T3 Home Demand Index
www.homedemandindex.com
Washington D.C. | March 2022
Condo Below $570k
The Index for lower-priced condos rose 14 percent in February but remained in the Moderate range. The Index, at 128, was more than 10 percent lower than one year earlier, suggesting that demand in the early months of the spring market is starting off at a slower pace. The months supply of homes on the market decreased to 1.9 from 2.1 months in January.

Monthly Statistics for Condo Below $570k
Home Demand
Index
Index
128
(Moderate)
Home Demand Index
from prior month
from prior month
112
Home Demand Index
from prior year
from prior year
148
Months of
Inventory
Inventory
1.9
Average daily inventory last month
1,437
Inventory sold
last month
last month
743
Bright MLS | T3 Home Demand Index
www.homedemandindex.com
Washington D.C. | March 2022
Condo Above $570k
Demand for higher-priced condos increased over the month from an already elevated level in January. The Index, at 161, was somewhat lower than the level one year earlier, however. The months supply decreased from three months in January to 2.5 months in February, which is consistent with strong demand and increased buyer activity.

Monthly Statistics for Condo Above $570k
Home Demand
Index
Index
161
(High)
Home Demand Index
from prior month
from prior month
148
Home Demand Index
from prior year
from prior year
172
Months of
Inventory
Inventory
2.5
Average daily inventory last month
348
Inventory sold
last month
last month
137
Bright MLS | T3 Home Demand Index
www.homedemandindex.com
Washington D.C. | March 2022
Townhouse/Rowhouse/Twin All prices
Townhouse/
Rowhouse/Twin
All prices
The Bright MLS | T3 Home Demand Index for the townhouse segment rose to a Steady reading of 109 in February from a Slow pace of demand in January. The months supply remained extraordinarily low with just a one-month supply, down from 1.2 months in February.

Monthly Statistics for Townhouse/Rowhouse/TwinAll prices
Home Demand
Index
Index
109
(Steady)
Home Demand Index
from prior month
from prior month
89
Home Demand Index
from prior year
from prior year
112
Months of
Inventory
Inventory
1
Average daily inventory last month
1,274
Inventory sold
last month
last month
1,223
Bright MLS | T3 Home Demand Index
www.homedemandindex.com
Note
1. This report is generated with data from the following counties:
- Maryland-West Virginia Panhandle – Allegany, MD; Berkeley, WV; Garrett, MD; Grant, WV; Hampshire, WV; Hardy, WV; Jefferson, WV; Mineral, WV; Morgan, WV; Pendleton, WV; Washington, MD;
- North Central Virginia – Caroline, VA; Clarke, VA; Culpeper, VA; Fauquier, VA; Frederick, VA; Fredericksburg City, VA; King George, VA; Madison, VA; Manassas City, VA; Orange, VA; Page, VA; Prince William, VA; Rappahannock, VA; Shenandoah, VA; Spotsylvania, VA; Stafford, VA; Warren, VA; Winchester City, VA;
- Southern Maryland – Calvert, MD; Charles, MD; Saint Marys, MD;
- Washington D.C. Metro – Alexandria City, VA; Arlington, VA; Fairfax, VA; Falls Church City, VA; Frederick, MD; Loudoun, VA; Montgomery, MD; Prince Georges, MD; Washington, DC;
2. This report is for the March 2022 period with data collected from the previous month.
Released: March 11, 2022
Reference ID: 1586
Washington D.C. | March 2022
Home Demand Map (Zip Codes)
Buyer interest in Arlington County and Alexandria City homes remained in the High category in February. Demand was Moderate in Fairfax and Prince Georges counties. Other counties in the Washington Metro area recorded buyer demand ranging from Steady in Loudoun and Montgomery counties to Limited in Falls Church City. Demand was Moderate in Southern Maryland and the Maryland-West Virginia Panhandle market area and Steady in the North Central Virginia region. Across the Greater Washington area, demand in 27 percent of ZIP codes was in the High range compared with 16 percent in January. At the same time, the share of ZIP codes with Limited demand fell from 47 percent in January to 37 percent in February.

Bright MLS | T3 Home Demand Index
www.homedemandindex.com