May 2024 Report
Washington D.C. Metro
Washington D.C. | May 2024
Home Demand Index
In May 2024, the Home Demand Index (HDI) for the Washington DC Metro area stands at 87, indicating a steady yet cautious improvement from the previous month’s HDI of 86. Despite this positive trajectory, the index remains lower than the previous year’s HDI of 95, reflecting a year of softening market conditions amid evolving economic factors.
In Washington D.C., May 2024 saw a significant increase in demand for higher-priced single-family homes and condos, indicating robust market activity in these segments. The index for these home types showed noticeable gains from the previous month, highlighting strong buyer interest. Despite this rising demand, the inventory levels remained constrained, which likely fueled competitive conditions and drove the indices higher. This trend reflects a vigorous market for upscale properties in the capital, with sustained buyer enthusiasm despite limited availability.

Monthly Statistics for May 2024
Home Demand
Index
Index
87
(Slow)
Home Demand Index
from prior month
from prior month
86
Home Demand Index
from prior year
from prior year
95
Index change
from prior month
from prior month
1.2%
Index change from
same time last year
same time last year
-8.4%
Bright MLS | T3 Home Demand Index
www.homedemandindex.com
Washington D.C. | May 2024
Home Demand Index | Historical Year-over-Year Comparison
From May 2023 to April 2024, Washington D.C.’s Home Demand Index (HDI) illustrates a a dip and substantial recovery in the housing market. Starting in the “Steady” range, the HDI dropped through late 2023 and from January 2024 had a resurgence indicating growing buyer activity. By April 2024, the index nearly returned to the Steady levels as seen in last year’s summer levels, showcasing a resilient market. As it stands, the market is hovering between Steady and Limited Index as we approach the Summer months.
Home Demand Index
Bright MLS | T3 Home Demand Index
www.homedemandindex.com
Washington D.C. | May 2024
Home Demand Map
Washington DC Metro’s HDI for May 2024 stands at 87, categorized as “Slow,” showing consistent but reduced buyer activity compared to the baseline. Nearby, Southern Maryland exhibits a steadier market with an HDI of 107, classified as “Steady.” In contrast, the Maryland-West Virginia Panhandle shows a significantly more active market with an HDI of 116, falling into the “Moderate” category, which suggests a consistently strong buyer interest. North Central Virginia has an HDI of 84, also categorized as “Slow,” similar to the Washington DC Metro.
Bright MLS | T3 Home Demand Index
www.homedemandindex.com
Washington D.C. | May 2024
Demand and Inventory by Home Type
In Washington D.C., May 2024 saw a significant increase in demand for higher-priced single-family homes and condos, indicating robust market activity in these segments. The index for these home types showed noticeable gains from the previous month, highlighting strong buyer interest. Despite this rising demand, the inventory levels remained constrained, which likely fueled competitive conditions and drove the indices higher. This trend reflects a vigorous market for upscale properties in the capital, with sustained buyer enthusiasm despite limited availability.
Bright MLS | T3 Home Demand Index
www.homedemandindex.com
Washington D.C. | May 2024
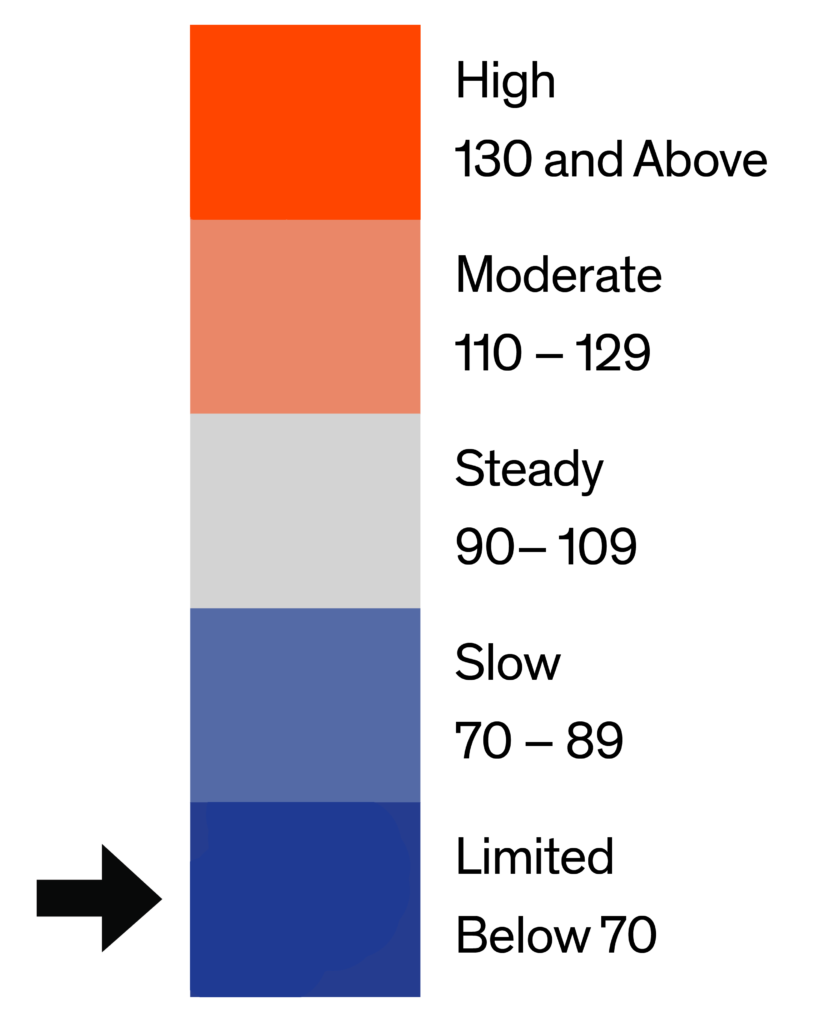
Single Family Home Below $530k
For single-family homes priced below $530k, the index stands at 67, marking an 11% decrease from last month’s 75 and significantly below the previous year’s 85. The Index was consistent with a Limited pace of buyer interest. There was a 1.6 months supply of homes available for sale, down from 1.8 months in March. The buyer interest for this segment moved from Slow to Limited, possibly due to relatively higher interest rates.

Monthly Statistics for Single Family Home Below $530k
Home Demand
Index
Index
67
(Limited)
Home Demand Index
from prior month
from prior month
75
Home Demand Index
from prior year
from prior year
85
Months of
inventory
inventory
1.6
Average daily inventory last month
601
Inventory sold
last month
last month
385
Bright MLS | T3 Home Demand Index
www.homedemandindex.com
Washington D.C. | May 2024
Single Family Home $530k - $1260k
In the mid-range market, single-family homes priced between $530k and $1.26M show healthier demand with an HDI of 84, reflecting a 9% increase from previous month’s 77 but still down from the previous year 92. This segment indicates consistent buyer interest likely driven by a combination of favorable lending rates and a robust employment market in the DC area. The months supply, at 1.1 was unchanged at 1.1 months.

Monthly Statistics for Single Family Home $530k - $1260k
Home Demand
Index
Index
84
(Slow)
Home Demand Index
from prior month
from prior month
77
Home Demand Index
from prior year
from prior year
92
Months of
Inventory
Inventory
1.1
Average daily inventory last month
1,177
Inventory sold
last month
last month
1,117
Bright MLS | T3 Home Demand Index
www.homedemandindex.com
Washington D.C. | May 2024
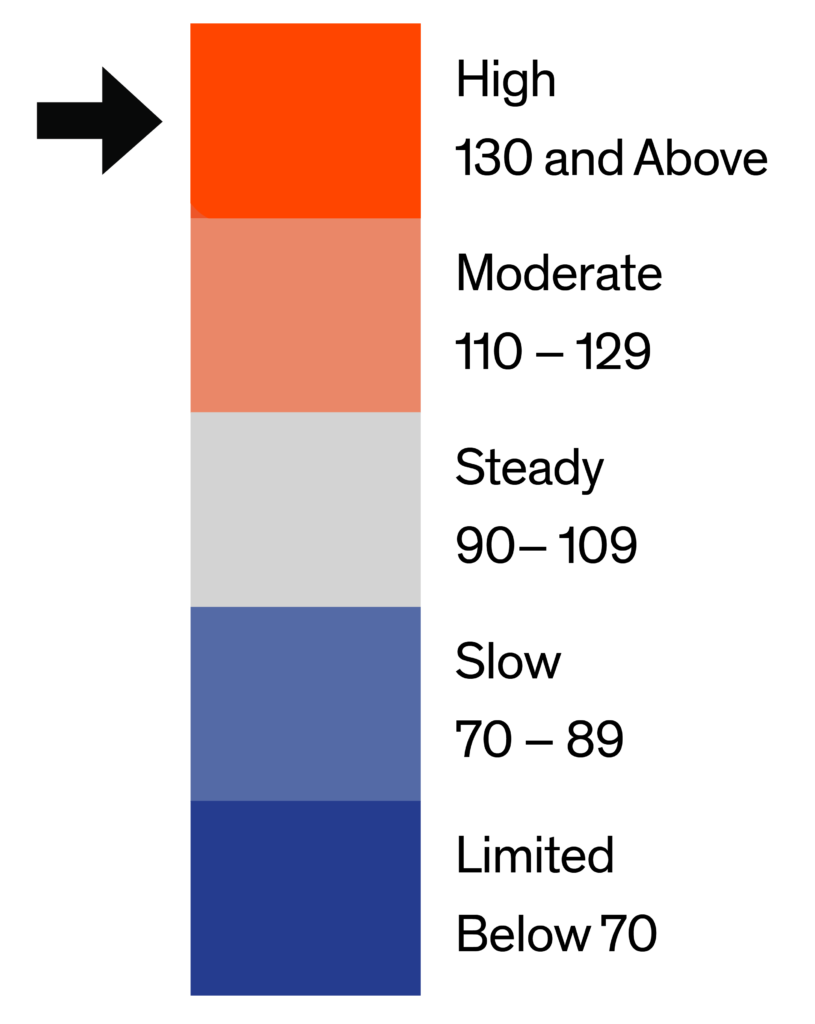
Single Family Home Above $1260k
Luxury single-family homes above $1.26M record an HDI of 136, marking a 10% increase from the previous month’s 124 and 10% higher than the previous year’s 124. This segment demonstrating high demand in the upper echelons of the market, buoyed by affluent buyers and a strong appetite for premium properties. The months supply, at 1.7 months, was down from 2.6 months in March.

Monthly Statistics for Single Family Home Above $1260k
Home Demand
Index
Index
136
(High)
Home Demand Index
from prior month
from prior month
124
Home Demand Index
from prior year
from prior year
124
Months of
Inventory
Inventory
1.7
Average daily inventory last month
630
Inventory sold
last month
last month
362
Bright MLS | T3 Home Demand Index
www.homedemandindex.com
Washington D.C. | May 2024
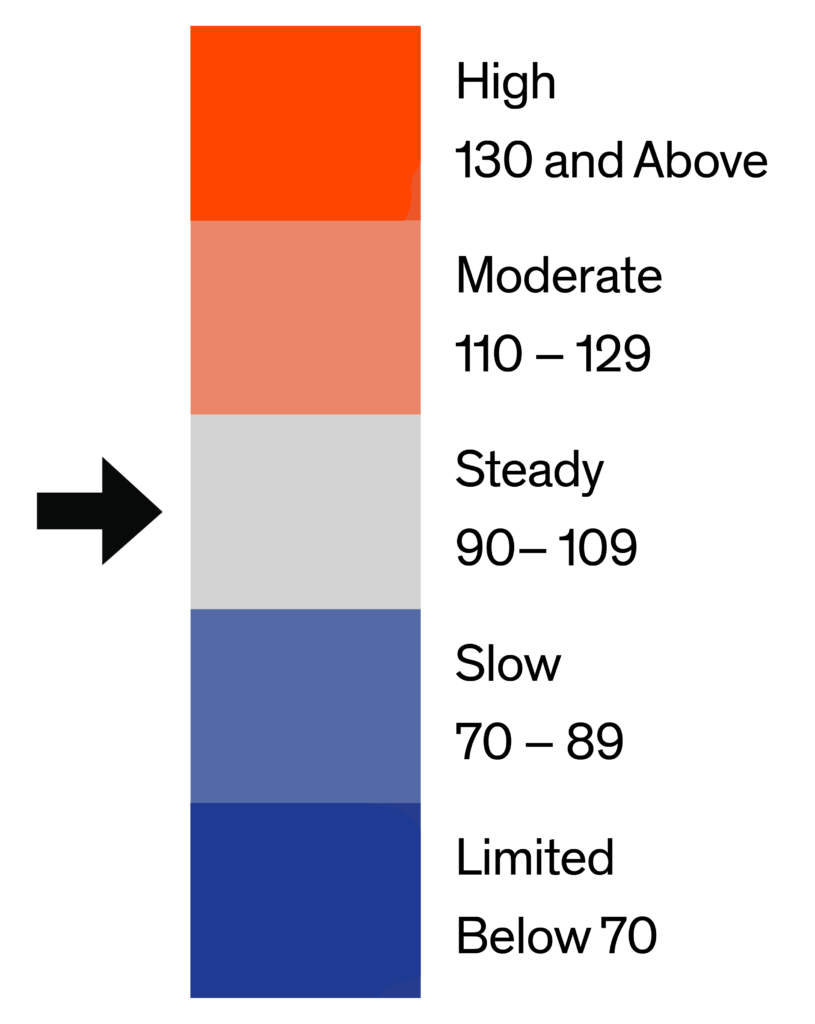
Condo Below $571k
Condos priced below $571k exhibit an HDI of 100, a 3% decrease from the previous month’s 103 and a 1% a slightly increase compared to the previous year’s 99. This segment indicating steady demand that aligns with broader market trends towards downsizing and urban living, particularly among younger demographics. The months supply, at 2.1, was marginally lower than the previous month.

Monthly Statistics for Condo Below $571k
Home Demand
Index
Index
100
(Steady)
Home Demand Index
from prior month
from prior month
103
Home Demand Index
from prior year
from prior year
99
Months of
Inventory
Inventory
2.1
Average daily inventory last month
1,429
Inventory sold
last month
last month
674
Bright MLS | T3 Home Demand Index
www.homedemandindex.com
Washington D.C. | May 2024
Condo Above $571k
For higher-end condos above $571k, the index rises to 139, reflecting an 8% increase from the previous month’s 129 and a significant decrease compared to the previous year’s 160. This segment signifying solid market activity as more buyers look for luxury amenities and central locations, despite higher price points. The months supply of homes, at 2.8 months, was down from 3.2 months the previous month.

Monthly Statistics for Condo Above $571k
Home Demand
Index
Index
139
(High)
Home Demand Index
from prior month
from prior month
129
Home Demand Index
from prior year
from prior year
160
Months of
Inventory
Inventory
2.8
Average daily inventory last month
414
Inventory sold
last month
last month
150
Bright MLS | T3 Home Demand Index
www.homedemandindex.com
Washington D.C. | May 2024
Townhouse/Rowhouse/Twin All prices
Townhouse/
Rowhouse/Twin
All prices
The townhouse, rowhouse, and twin homes market, categorized under ‘All prices’, the index slightly decrease to 81, lower than the from the previous month’s 83, and also 13% lower than one year earlier. This segment remained in the Slow pace. While the inventory for this segment slightly increased, the months supply decreased to 1.5 in April from 1.7 in March.

Monthly Statistics for Townhouse/Rowhouse/TwinAll prices
Home Demand
Index
Index
81
(Slow)
Home Demand Index
from prior month
from prior month
83
Home Demand Index
from prior year
from prior year
93
Months of
Inventory
Inventory
1.5
Average daily inventory last month
1,766
Inventory sold
last month
last month
1,186
Bright MLS | T3 Home Demand Index
www.homedemandindex.com
Note
1. This report is generated with data from the following counties:
- Maryland-West Virginia Panhandle – Allegany, MD; Berkeley, WV; Garrett, MD; Grant, WV; Hampshire, WV; Hardy, WV; Jefferson, WV; Mineral, WV; Morgan, WV; Pendleton, WV; Washington, MD;
- North Central Virginia – Caroline, VA; Clarke, VA; Culpeper, VA; Fauquier, VA; Frederick, VA; Fredericksburg City, VA; King George, VA; Madison, VA; Manassas City, VA; Orange, VA; Page, VA; Prince William, VA; Rappahannock, VA; Shenandoah, VA; Spotsylvania, VA; Stafford, VA; Warren, VA; Winchester City, VA;
- Southern Maryland – Calvert, MD; Charles, MD; Saint Marys, MD;
- Washington D.C. Metro – Alexandria City, VA; Arlington, VA; Fairfax, VA; Falls Church City, VA; Frederick, MD; Loudoun, VA; Montgomery, MD; Prince Georges, MD; Washington, DC;
2. This report is for the May 2024 period with data collected from the previous month.
Released: May 11, 2024
Reference ID: 2037
Washington D.C. | May 2024
Home Demand Map (Zip Codes)
Washington DC Metro’s HDI for May 2024 stands at 87, categorized as “Slow,” showing consistent but reduced buyer activity compared to the baseline. Nearby, Southern Maryland exhibits a steadier market with an HDI of 107, classified as “Steady.” In contrast, the Maryland-West Virginia Panhandle shows a significantly more active market with an HDI of 116, falling into the “Moderate” category, which suggests a consistently strong buyer interest. North Central Virginia has an HDI of 84, also categorized as “Slow,” similar to the Washington DC Metro.

Bright MLS | T3 Home Demand Index
www.homedemandindex.com